Stakeholder Management Jobs in the Midlands

Stakeholder Management
England > Midlands

The table below provides summary statistics for permanent job vacancies advertised in the Midlands requiring Stakeholder Management skills. It includes a benchmarking guide to the annual salaries offered in vacancies that cited Stakeholder Management over the 6 months leading up to 12 May 2025, comparing them to the same period in the previous two years.

6 months to
12 May 2025
Same period 2024 Same period 2023
Rank 50 47 43
Rank change year-on-year -3 -4 +3
Permanent jobs citing Stakeholder Management 318 511 598
As % of all permanent jobs advertised in the Midlands 4.50% 4.30% 6.47%
As % of the Processes & Methodologies category 4.91% 5.24% 6.70%
Number of salaries quoted 216 392 357
10th Percentile £38,754 £32,500 £41,250
25th Percentile £45,000 £43,250 £49,000
Median annual salary (50th Percentile) £58,000 £54,250 £55,000
Median % change year-on-year +6.91% -1.36% +4.76%
75th Percentile £70,313 £67,500 £68,750
90th Percentile £87,250 £84,964 £81,350
England median annual salary £62,500 £62,500 £65,000
% change year-on-year - -3.85% +4.00%

All Process and Methodology Skills
Midlands

Stakeholder Management falls under the Processes and Methodologies category. For comparison with the information above, the following table provides summary statistics for all permanent job vacancies requiring process or methodology skills in the Midlands.

Permanent vacancies with a requirement for process or methodology skills 6,479 9,747 8,924
As % of all permanent jobs advertised in the Midlands 91.67% 82.00% 96.52%
Number of salaries quoted 2,672 7,160 4,510
10th Percentile £27,500 £26,250 £30,000
25th Percentile £35,000 £34,834 £38,362
Median annual salary (50th Percentile) £50,000 £47,500 £52,500
Median % change year-on-year +5.26% -9.52% +5.00%
75th Percentile £63,750 £62,270 £67,500
90th Percentile £76,250 £75,000 £77,500
England median annual salary £57,500 £55,000 £62,500
% change year-on-year +4.55% -12.00% +4.17%

Stakeholder Management
Job Vacancy Trend in the Midlands

Job postings citing Stakeholder Management as a proportion of all IT jobs advertised in the Midlands.
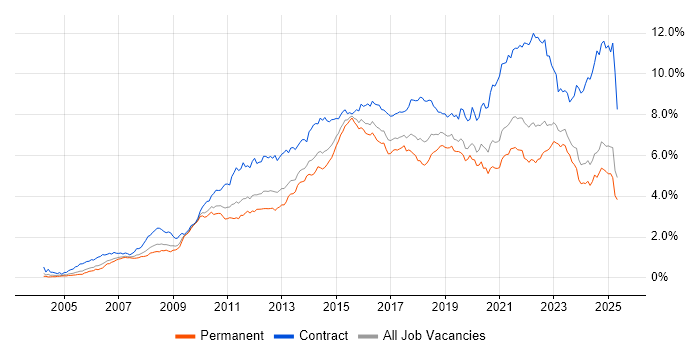
Job vacancy trend for Stakeholder Management in the Midlands

Stakeholder Management
Salary Trend in the Midlands

3-month moving average salary quoted in jobs citing Stakeholder Management in the Midlands.

Salary trend for Stakeholder Management in the Midlands

Stakeholder Management
Salary Histogram in the Midlands

Salary distribution for jobs citing Stakeholder Management in the Midlands over the 6 months to 12 May 2025.

Salary histogram for Stakeholder Management in the Midlands

Stakeholder Management
Job Locations in the Midlands

The table below looks at the demand and provides a guide to the median salaries quoted in IT jobs citing Stakeholder Management within the Midlands region over the 6 months to 12 May 2025. The 'Rank Change' column provides an indication of the change in demand within each location based on the same 6 month period last year.

Location Rank Change
on Same Period
Last Year
Matching
Permanent
IT Job Ads
Median Salary
Past 6 Months
Median Salary
% Change
on Same Period
Last Year
Live
Jobs
West Midlands +4 233 £55,000 - 141
East Midlands -17 85 £60,000 +11.11% 75
Stakeholder Management
England

Stakeholder Management
Co-occurring Skills and Capabilities in the Midlands by Category

The follow tables expand on the table above by listing co-occurrences grouped by category. The same employment type, locality and period is covered with up to 20 co-occurrences shown in each of the following categories:

Application Platforms
1 7 (2.20%) SharePoint
2 3 (0.94%) Apache Spark
2 3 (0.94%) Confluence
3 1 (0.31%) CMS
3 1 (0.31%) ColdFusion
3 1 (0.31%) Mendix
Applications
1 18 (5.66%) Microsoft Office
2 9 (2.83%) Microsoft Excel
3 7 (2.20%) Microsoft Project
4 5 (1.57%) Microsoft PowerPoint
5 2 (0.63%) Adobe Captivate
5 2 (0.63%) ProjectWise
6 1 (0.31%) Trello
Business Applications
1 12 (3.77%) NetSuite
2 8 (2.52%) Salesforce CRM
3 5 (1.57%) Shopify
4 4 (1.26%) Dynamics CRM
5 2 (0.63%) Infor M3
5 2 (0.63%) SAP S/4HANA
6 1 (0.31%) Dynamics AX
6 1 (0.31%) Maximo
6 1 (0.31%) Oracle Payroll
6 1 (0.31%) Remedy ITSM
6 1 (0.31%) SAP CAR
6 1 (0.31%) SAP GRC
6 1 (0.31%) SAP Retail
6 1 (0.31%) SAP SD
6 1 (0.31%) Sparx Enterprise Architect
Cloud Services
1 33 (10.38%) Azure
2 23 (7.23%) SaaS
3 20 (6.29%) AWS
4 16 (5.03%) Power Platform
5 8 (2.52%) Microsoft 365
5 8 (2.52%) Miro
6 7 (2.20%) Azure DevOps
6 7 (2.20%) Azure Synapse Analytics
6 7 (2.20%) Serverless
7 6 (1.89%) Amazon EC2
7 6 (1.89%) Amazon S3
7 6 (1.89%) GCP
8 5 (1.57%) Azure Service Bus
8 5 (1.57%) GitHub
8 5 (1.57%) Google Analytics
8 5 (1.57%) Snowflake
9 4 (1.26%) AWS Lambda
9 4 (1.26%) Cloud Computing
9 4 (1.26%) Firebase
9 4 (1.26%) Google Tag Manager
Communications & Networking
1 2 (0.63%) Firewall
1 2 (0.63%) VPN
2 1 (0.31%) ATM
2 1 (0.31%) Frame Relay
2 1 (0.31%) LAN
2 1 (0.31%) Network Security
2 1 (0.31%) PBX
2 1 (0.31%) PSTN
2 1 (0.31%) SDH
2 1 (0.31%) Unified Communications
2 1 (0.31%) VoIP
2 1 (0.31%) WAN
2 1 (0.31%) Wi-Fi
Database & Business Intelligence
1 16 (5.03%) Power BI
2 12 (3.77%) Data Warehouse
3 9 (2.83%) Metadata
4 7 (2.20%) Metadata Repository
4 7 (2.20%) PostgreSQL
4 7 (2.20%) Tableau
5 6 (1.89%) Amazon Redshift
5 6 (1.89%) NoSQL
6 5 (1.57%) BigQuery
6 5 (1.57%) SQL Server
7 4 (1.26%) Spark SQL
8 3 (0.94%) Amazon Athena
8 3 (0.94%) Amazon RDS
8 3 (0.94%) Parquet
9 2 (0.63%) Amazon Aurora
9 2 (0.63%) Azure SQL Database
9 2 (0.63%) GIS
9 2 (0.63%) SQL Server Integration Services
9 2 (0.63%) SQL Server Reporting Services
10 1 (0.31%) SQL Server Analysis Services
Development Applications
1 25 (7.86%) JIRA
2 18 (5.66%) Rational DOORS
3 6 (1.89%) Git
4 4 (1.26%) GitLab
5 3 (0.94%) Jenkins
6 2 (0.63%) ERwin
6 2 (0.63%) JUnit
6 2 (0.63%) Maven
6 2 (0.63%) Mockito
6 2 (0.63%) SonarQube
7 1 (0.31%) Bitbucket Server
7 1 (0.31%) DbUnit
7 1 (0.31%) jMock
7 1 (0.31%) Subversion
7 1 (0.31%) Vagrant
General
1 124 (38.99%) Social Skills
2 113 (35.53%) Finance
3 54 (16.98%) Analytical Skills
4 31 (9.75%) Inclusion and Diversity
5 21 (6.60%) Public Sector
6 17 (5.35%) Presentation Skills
7 16 (5.03%) Financial Institution
8 15 (4.72%) Law
9 14 (4.40%) Marketing
10 12 (3.77%) Retail
11 9 (2.83%) Influencing Skills
11 9 (2.83%) Police
12 8 (2.52%) Banking
12 8 (2.52%) Documentation Skills
13 7 (2.20%) Manufacturing
14 6 (1.89%) Organisational Skills
15 5 (1.57%) Billing
16 3 (0.94%) Advertising
16 3 (0.94%) Legal
16 3 (0.94%) Telecoms
Job Titles
1 57 (17.92%) Analyst
2 42 (13.21%) Project Manager
3 34 (10.69%) Lead
4 28 (8.81%) Architect
4 28 (8.81%) Senior
5 27 (8.49%) Business Analyst
6 18 (5.66%) Engineering Manager
6 18 (5.66%) Requirements Manager
7 17 (5.35%) Consultant
8 16 (5.03%) Solutions Architect
9 15 (4.72%) IT Manager
10 9 (2.83%) Product Owner
10 9 (2.83%) Senior Analyst
11 8 (2.52%) Agile Product Owner
11 8 (2.52%) IT Consultant
11 8 (2.52%) Programme Manager
11 8 (2.52%) Systems Analyst
12 7 (2.20%) CRM Analyst
12 7 (2.20%) Developer
12 7 (2.20%) Senior Manager
Libraries, Frameworks & Software Standards
1 10 (3.14%) REST
2 8 (2.52%) React
3 7 (2.20%) EDI
4 6 (1.89%) HTML
4 6 (1.89%) SOAP
5 5 (1.57%) CSS
5 5 (1.57%) Node.js
6 4 (1.26%) PySpark
7 3 (0.94%) AngularJS
7 3 (0.94%) Bootstrap
7 3 (0.94%) Lightning Web Components
7 3 (0.94%) RESTful
7 3 (0.94%) Ruby on Rails
7 3 (0.94%) Web Services
7 3 (0.94%) XGBoost
8 2 (0.63%) ActiveMQ
8 2 (0.63%) JSON
8 2 (0.63%) Middleware
8 2 (0.63%) MIDP
8 2 (0.63%) Spring
Miscellaneous
1 24 (7.55%) Product Ownership
2 18 (5.66%) Legacy Systems
2 18 (5.66%) Onboarding
3 17 (5.35%) Management Information System
4 10 (3.14%) Data Protection Act
5 8 (2.52%) Credit Risk
6 7 (2.20%) Mobile App
6 7 (2.20%) NHS
6 7 (2.20%) Taxonomies
7 6 (1.89%) Cloud Native
7 6 (1.89%) Virtual Team
8 5 (1.57%) Data Structures
8 5 (1.57%) Self-Motivation
9 3 (0.94%) Housing Association
9 3 (0.94%) Legacy Applications
9 3 (0.94%) PropTech
10 2 (0.63%) Enterprise Software
10 2 (0.63%) Learning Management System
10 2 (0.63%) Low-Code
10 2 (0.63%) Operational Technology
Operating Systems
1 7 (2.20%) Windows
2 4 (1.26%) Windows Server
3 2 (0.63%) Linux
4 1 (0.31%) Android
4 1 (0.31%) Apple iOS
4 1 (0.31%) CentOS
4 1 (0.31%) Debian
4 1 (0.31%) VMS
Processes & Methodologies
1 76 (23.90%) Project Management
2 75 (23.58%) Agile
3 55 (17.30%) Problem-Solving
4 48 (15.09%) Decision-Making
5 45 (14.15%) Roadmaps
6 41 (12.89%) Change Management
7 39 (12.26%) Project Delivery
7 39 (12.26%) Risk Management
8 37 (11.64%) Continuous Improvement
9 36 (11.32%) Analytics
9 36 (11.32%) Stakeholder Engagement
10 35 (11.01%) ITIL
11 32 (10.06%) Process Improvement
12 31 (9.75%) CRM
13 26 (8.18%) Mentoring
14 25 (7.86%) Requirements Gathering
14 25 (7.86%) Scrum
15 24 (7.55%) Collaborative Working
15 24 (7.55%) Validation
15 24 (7.55%) Waterfall
Programming Languages
1 28 (8.81%) SQL
2 10 (3.14%) Python
3 9 (2.83%) JavaScript
4 5 (1.57%) Java
5 4 (1.26%) Data Analysis Expressions
5 4 (1.26%) PowerShell
6 3 (0.94%) Apex Code
6 3 (0.94%) Ruby
7 2 (0.63%) PHP
7 2 (0.63%) R
8 1 (0.31%) T-SQL
Qualifications
1 36 (11.32%) Degree
2 19 (5.97%) BPSS Clearance
3 13 (4.09%) DBS Check
4 7 (2.20%) CBAP
4 7 (2.20%) Security Cleared
5 6 (1.89%) IIBA
5 6 (1.89%) ITIL Foundation Certificate
6 5 (1.57%) Azure Certification
6 5 (1.57%) PMI Certification
6 5 (1.57%) PMP
7 4 (1.26%) AWS Certification
7 4 (1.26%) CISM
7 4 (1.26%) MRICS
7 4 (1.26%) SC Cleared
8 3 (0.94%) CISA
8 3 (0.94%) CISSP
8 3 (0.94%) HNC
8 3 (0.94%) HND
8 3 (0.94%) ISEB
9 2 (0.63%) CITP
Quality Assurance & Compliance
1 20 (6.29%) Data Quality
1 20 (6.29%) QA
2 13 (4.09%) PMO
3 9 (2.83%) GDPR
4 7 (2.20%) California Consumer Privacy Act
5 6 (1.89%) ISO/IEC 27001
6 3 (0.94%) PMBOK
7 2 (0.63%) Accessibility
7 2 (0.63%) Cyber Essentials
8 1 (0.31%) GRC
8 1 (0.31%) ISO 9001
8 1 (0.31%) NIST
8 1 (0.31%) P3O
8 1 (0.31%) PCI DSS
8 1 (0.31%) SLA
System Software
1 5 (1.57%) VMware Infrastructure
2 3 (0.94%) Docker
3 1 (0.31%) Postfix
Systems Management
1 6 (1.89%) Terraform
2 3 (0.94%) Kubernetes
3 2 (0.63%) Ansible
3 2 (0.63%) FortiGate
3 2 (0.63%) Grafana
3 2 (0.63%) Prometheus
4 1 (0.31%) Consul
4 1 (0.31%) Marathon
4 1 (0.31%) Packer
4 1 (0.31%) Progress Chef
Vendors
1 46 (14.47%) Microsoft
2 35 (11.01%) Salesforce
3 10 (3.14%) Google
4 9 (2.83%) Databricks
5 8 (2.52%) SAP
6 7 (2.20%) Avaloq
7 6 (1.89%) VMware
8 4 (1.26%) NEC
8 4 (1.26%) Optimizely
8 4 (1.26%) YouTube
9 3 (0.94%) Oracle
10 2 (0.63%) Adobe
10 2 (0.63%) Apple
10 2 (0.63%) Atlassian
10 2 (0.63%) Dell
10 2 (0.63%) HP
10 2 (0.63%) Infor
10 2 (0.63%) Micro Focus
10 2 (0.63%) Sophos
10 2 (0.63%) Veeam