Performance Tuning Jobs in the South East

Performance Tuning
England > South East

The table below provides summary statistics for permanent job vacancies advertised in the South East requiring Performance Tuning skills. It includes a benchmarking guide to the annual salaries offered in vacancies that cited Performance Tuning over the 6 months leading up to 30 May 2025, comparing them to the same period in the previous two years.

6 months to
30 May 2025
Same period 2024 Same period 2023
Rank 271 298 330
Rank change year-on-year +27 +32 -9
Permanent jobs citing Performance Tuning 41 102 66
As % of all permanent jobs advertised in the South East 0.43% 0.58% 0.47%
As % of the Processes & Methodologies category 0.46% 0.70% 0.50%
Number of salaries quoted 26 67 53
10th Percentile £47,500 - £31,250
25th Percentile £55,000 £41,250 £42,500
Median annual salary (50th Percentile) £65,000 £57,500 £60,000
Median % change year-on-year +13.04% -4.17% -
75th Percentile £66,875 £61,250 £65,000
90th Percentile £90,625 £80,500 £82,150
England median annual salary £62,500 £59,000 £60,000
% change year-on-year +5.93% -1.67% -4.00%

All Process and Methodology Skills
South East

Performance Tuning falls under the Processes and Methodologies category. For comparison with the information above, the following table provides summary statistics for all permanent job vacancies requiring process or methodology skills in the South East.

Permanent vacancies with a requirement for process or methodology skills 8,872 14,647 13,269
As % of all permanent jobs advertised in the South East 92.08% 83.51% 94.48%
Number of salaries quoted 4,278 10,075 7,715
10th Percentile £29,175 £27,750 £30,500
25th Percentile £39,750 £36,875 £41,250
Median annual salary (50th Percentile) £55,000 £50,000 £55,000
Median % change year-on-year +10.00% -9.09% -
75th Percentile £70,000 £65,000 £72,500
90th Percentile £78,750 £77,500 £85,000
England median annual salary £57,500 £55,000 £62,500
% change year-on-year +4.55% -12.00% +4.17%

Performance Tuning
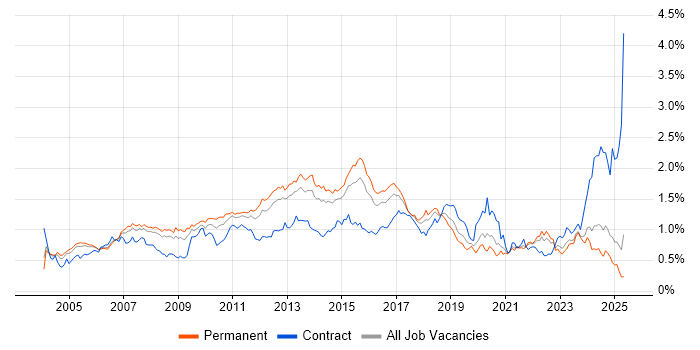
Job Vacancy Trend in the South East

Job postings citing Performance Tuning as a proportion of all IT jobs advertised in the South East.

Job vacancy trend for Performance Tuning in the South East

Performance Tuning
Salary Trend in the South East

3-month moving average salary quoted in jobs citing Performance Tuning in the South East.

Salary trend for Performance Tuning in the South East

Performance Tuning
Salary Histogram in the South East

Salary distribution for jobs citing Performance Tuning in the South East over the 6 months to 30 May 2025.

Salary histogram for Performance Tuning in the South East

Performance Tuning
Job Locations in the South East

The table below looks at the demand and provides a guide to the median salaries quoted in IT jobs citing Performance Tuning within the South East region over the 6 months to 30 May 2025. The 'Rank Change' column provides an indication of the change in demand within each location based on the same 6 month period last year.

Location Rank Change
on Same Period
Last Year
Matching
Permanent
IT Job Ads
Median Salary
Past 6 Months
Median Salary
% Change
on Same Period
Last Year
Live
Jobs
Thames Valley +30 26 £60,000 +3.00% 198
Berkshire +5 14 £70,000 +18.64% 129
Surrey +49 10 £65,000 +13.04% 44
Buckinghamshire +28 10 £60,000 +41.18% 43
Kent +35 3 £85,000 +47.83% 43
Oxfordshire +30 2 £57,500 +35.29% 26
Hampshire +66 1 £95,000 +65.22% 60
Middlesex -20 1 - -
Performance Tuning
England

Performance Tuning
Co-occurring Skills and Capabilities in the South East by Category

The follow tables expand on the table above by listing co-occurrences grouped by category. The same employment type, locality and period is covered with up to 20 co-occurrences shown in each of the following categories:

Application Platforms
1 10 (24.39%) Apache Spark
2 5 (12.20%) Apache
3 1 (2.44%) GemFire
Applications
1 6 (14.63%) Microsoft Excel
Cloud Services
1 32 (78.05%) Azure
2 19 (46.34%) AWS
3 16 (39.02%) GCP
4 12 (29.27%) Power Platform
5 11 (26.83%) Azure Monitor
6 6 (14.63%) Azure Data Factory
6 6 (14.63%) Azure DevOps
7 4 (9.76%) Amazon S3
8 3 (7.32%) Datadog
8 3 (7.32%) Snowflake
9 2 (4.88%) Cloud Computing
9 2 (4.88%) IaaS
9 2 (4.88%) Serverless
10 1 (2.44%) AWS IoT
10 1 (2.44%) AWS Lambda
Communications & Networking
1 2 (4.88%) LAN
1 2 (4.88%) WAN
2 1 (2.44%) MQTT
Database & Business Intelligence
1 12 (29.27%) Data Warehouse
1 12 (29.27%) Power BI
2 11 (26.83%) SQL Server
3 10 (24.39%) Big Data
4 8 (19.51%) SQL Server Integration Services
4 8 (19.51%) SQL Server Reporting Services
5 4 (9.76%) Data Lake
5 4 (9.76%) Parquet
6 2 (4.88%) Elasticsearch
6 2 (4.88%) MySQL
7 1 (2.44%) Apache Ignite
7 1 (2.44%) Azure SQL Database
7 1 (2.44%) InterSystems Cache
7 1 (2.44%) MongoDB
7 1 (2.44%) NoSQL
7 1 (2.44%) RDBMS
7 1 (2.44%) Redis
7 1 (2.44%) Relational Database
Development Applications
1 6 (14.63%) JIRA
1 6 (14.63%) Visual Studio
2 2 (4.88%) Git
General
1 17 (41.46%) Social Skills
2 14 (34.15%) Finance
3 12 (29.27%) Law
4 11 (26.83%) Legal
5 8 (19.51%) Retail
6 3 (7.32%) Analytical Skills
6 3 (7.32%) Banking
6 3 (7.32%) Retail Banking
7 2 (4.88%) Documentation Skills
7 2 (4.88%) Investment Banking
8 1 (2.44%) Front Office
Job Titles
1 15 (36.59%) Senior
2 11 (26.83%) Senior Manager
3 6 (14.63%) Analyst
3 6 (14.63%) Business Intelligence Analyst
3 6 (14.63%) Lead
3 6 (14.63%) Software Engineer
4 5 (12.20%) DBA
5 4 (9.76%) Design Engineer
5 4 (9.76%) Developer
5 4 (9.76%) Development Engineer
6 3 (7.32%) C# Software Engineer
6 3 (7.32%) Infrastructure Engineer
6 3 (7.32%) Lead Software Engineer
6 3 (7.32%) Software Developer
6 3 (7.32%) SQL DBA
7 2 (4.88%) C# Developer
7 2 (4.88%) C# Software Developer
7 2 (4.88%) Lead Software Developer
7 2 (4.88%) MySQL DBA
7 2 (4.88%) Senior Infrastructure Engineer
Libraries, Frameworks & Software Standards
1 11 (26.83%) Hugging Face
1 11 (26.83%) LangChain
1 11 (26.83%) PyTorch
1 11 (26.83%) TensorFlow
2 8 (19.51%) AngularJS
3 6 (14.63%) .NET
3 6 (14.63%) ASP.NET
3 6 (14.63%) ASP.NET MVC
3 6 (14.63%) Pandas
4 5 (12.20%) Kafka
5 4 (9.76%) React
5 4 (9.76%) REST
6 3 (7.32%) GraphQL
6 3 (7.32%) RESTful
7 1 (2.44%) Middleware
7 1 (2.44%) RabbitMQ
7 1 (2.44%) Spring
Miscellaneous
1 11 (26.83%) Cloud Native
2 7 (17.07%) Algorithms
2 7 (17.07%) Data Structures
3 6 (14.63%) Public Cloud
4 1 (2.44%) Clustering
4 1 (2.44%) Credit Derivative
4 1 (2.44%) Derivative
4 1 (2.44%) Equities
4 1 (2.44%) Fixed Income
4 1 (2.44%) Foreign Exchange (FX)
4 1 (2.44%) IoT
4 1 (2.44%) Management Information System
4 1 (2.44%) Replication
Operating Systems
1 1 (2.44%) Linux
1 1 (2.44%) Unix
Processes & Methodologies
1 19 (46.34%) Computer Science
2 15 (36.59%) Machine Learning
3 14 (34.15%) Continuous Improvement
3 14 (34.15%) High Availability
3 14 (34.15%) Observability
4 12 (29.27%) Business Intelligence
4 12 (29.27%) Cloud Security
4 12 (29.27%) Roadmaps
4 12 (29.27%) Service Delivery
4 12 (29.27%) Stakeholder Engagement
5 11 (26.83%) Artificial Intelligence
5 11 (26.83%) Change Management
5 11 (26.83%) Data Privacy
5 11 (26.83%) Enterprise Architecture
5 11 (26.83%) Generative AI
5 11 (26.83%) Incident Management
5 11 (26.83%) ITIL
5 11 (26.83%) Problem Management
5 11 (26.83%) Root Cause Analysis
5 11 (26.83%) Service Management
Programming Languages
1 19 (46.34%) SQL
2 13 (31.71%) Python
3 9 (21.95%) C#
4 6 (14.63%) Bash
4 6 (14.63%) Data Analysis Expressions
4 6 (14.63%) JavaScript
4 6 (14.63%) PowerShell
5 5 (12.20%) Java
6 4 (9.76%) PL/SQL
7 1 (2.44%) T-SQL
Qualifications
1 20 (48.78%) Degree
2 13 (31.71%) Computer Science Degree
3 11 (26.83%) Master's Degree
4 6 (14.63%) Numerate Degree
5 3 (7.32%) AWS Certification
6 2 (4.88%) AWS Certified Solutions Architect
7 1 (2.44%) AWS Certified Developer
7 1 (2.44%) MCSE
7 1 (2.44%) Microsoft Certification
7 1 (2.44%) Security Cleared
7 1 (2.44%) VMware Certified Professional (VCP)
Quality Assurance & Compliance
1 4 (9.76%) Data Quality
2 3 (7.32%) GDPR
3 1 (2.44%) Accessibility
3 1 (2.44%) HIPAA
3 1 (2.44%) ISO/IEC 27001
3 1 (2.44%) SOC 2
System Software
1 3 (7.32%) Docker
Systems Management
1 15 (36.59%) Grafana
1 15 (36.59%) Prometheus
2 1 (2.44%) Kubernetes
Vendors
1 11 (26.83%) OpenAI
2 8 (19.51%) Microsoft
3 5 (12.20%) Oracle
4 3 (7.32%) Databricks
5 2 (4.88%) Google
5 2 (4.88%) Rollbar
5 2 (4.88%) VMware
6 1 (2.44%) Solace
6 1 (2.44%) TIBCO