Ansible Jobs in the South East

Ansible
England > South East

The following table provides summary statistics for permanent job vacancies advertised in the South East with a requirement for Ansible skills. Included is a benchmarking guide to the salaries offered in vacancies that have cited Ansible over the 6 months to 29 April 2024 with a comparison to the same period in the previous 2 years.

6 months to
29 Apr 2024
Same period 2023 Same period 2022
Rank 182 150 132
Rank change year-on-year -32 -18 -19
Permanent jobs citing Ansible 248 328 521
As % of all permanent jobs advertised in the South East 1.49% 2.19% 2.62%
As % of the Systems Management category 14.46% 15.92% 19.76%
Number of salaries quoted 162 163 208
10th Percentile £42,230 £41,916 £42,500
25th Percentile £55,000 £54,000 £47,500
Median annual salary (50th Percentile) £60,000 £70,000 £65,000
Median % change year-on-year -14.29% +7.69% +4.00%
75th Percentile £71,000 £83,750 £80,000
90th Percentile £83,750 £91,250 £88,250
England median annual salary £70,000 £72,000 £70,000
% change year-on-year -2.78% +2.86% +7.69%

All Systems Management Skills
South East

Ansible is in the Systems Management category. The following table is for comparison with the above and provides summary statistics for all permanent job vacancies advertised in the South East with a requirement for systems management skills.

Permanent vacancies with a requirement for systems management skills 1,715 2,060 2,636
As % of all permanent jobs advertised in the South East 10.30% 13.74% 13.28%
Number of salaries quoted 1,290 1,251 1,725
10th Percentile £31,250 £27,750 £32,500
25th Percentile £40,000 £38,725 £46,250
Median annual salary (50th Percentile) £55,000 £57,500 £65,000
Median % change year-on-year -4.35% -11.54% +13.04%
75th Percentile £72,375 £77,500 £82,500
90th Percentile £87,500 £92,500 £90,000
England median annual salary £60,000 £67,500 £70,000
% change year-on-year -11.11% -3.57% +7.69%

Ansible
Job Vacancy Trend in the South East

Job postings citing Ansible as a proportion of all IT jobs advertised in the South East.
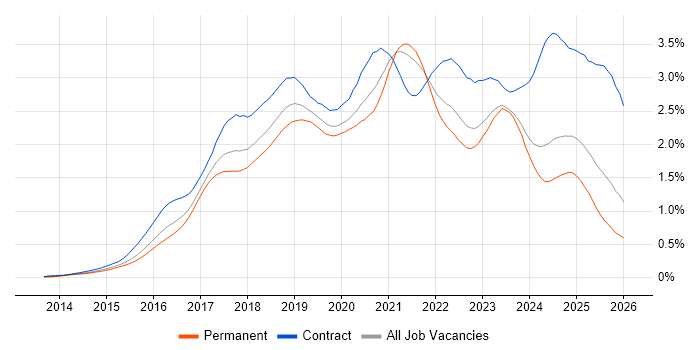
Job vacancy trend for Ansible in the South East

Ansible
Salary Trend in the South East

3-month moving average salary quoted in jobs citing Ansible in the South East.

Salary trend for Ansible in the South East

Ansible
Salary Histogram in the South East

Salary distribution for jobs citing Ansible in the South East over the 6 months to 29 April 2024.

Salary histogram for Ansible in the South East

Ansible
Job Locations in the South East

The table below looks at the demand and provides a guide to the median salaries quoted in IT jobs citing Ansible within the South East region over the 6 months to 29 April 2024. The 'Rank Change' column provides an indication of the change in demand within each location based on the same 6 month period last year.

Location Rank Change
on Same Period
Last Year
Matching
Permanent
IT Job Ads
Median Salary
Past 6 Months
Median Salary
% Change
on Same Period
Last Year
Live
Jobs
Thames Valley -20 111 £60,000 -11.11% 13
Berkshire +8 81 £69,000 -8.00% 8
Surrey +7 68 £55,000 -20.00% 2
Hampshire -40 40 £58,350 -19.52% 26
Oxfordshire +7 16 £55,000 +22.22% 1
Buckinghamshire -34 14 £58,750 -11.32% 4
West Sussex +39 12 £64,500 +3.20%
East Sussex +14 3 £70,000 +7.69% 1
Kent -1 1 £50,000 +8.11%
Ansible
England

Ansible
Co-occurring Skills and Capabilities in the South East by Category

The follow tables expand on the table above by listing co-occurrences grouped by category. The same employment type, locality and period is covered with up to 20 co-occurrences shown in each of the following categories:

Application Platforms
1 50 (20.16%) OpenStack
2 11 (4.44%) Apache
3 10 (4.03%) JBoss
3 10 (4.03%) Red Hat Fuse
4 8 (3.23%) nginx
5 3 (1.21%) Tomcat
6 1 (0.40%) Confluence
6 1 (0.40%) IIS
6 1 (0.40%) Microsoft Exchange
6 1 (0.40%) WebSphere
6 1 (0.40%) WordPress
Applications
1 10 (4.03%) Simulink
2 1 (0.40%) AutoCAD
2 1 (0.40%) PTC Creo
2 1 (0.40%) SOLIDWORKS
Cloud Services
1 99 (39.92%) Azure
2 95 (38.31%) AWS
3 44 (17.74%) Serverless
4 42 (16.94%) Amazon EKS
5 41 (16.53%) Amazon ECS
6 12 (4.84%) GitHub
7 11 (4.44%) Microsoft 365
8 10 (4.03%) Azure DevOps
8 10 (4.03%) GCP
9 7 (2.82%) Amazon S3
10 6 (2.42%) Cloud Computing
11 5 (2.02%) Amazon EC2
11 5 (2.02%) AWS CloudFormation
12 4 (1.61%) IaaS
12 4 (1.61%) PaaS
12 4 (1.61%) SaaS
13 3 (1.21%) Azure Pipelines
14 2 (0.81%) AWS Lambda
14 2 (0.81%) Entra ID
15 1 (0.40%) AWS CodeBuild
Communications & Networking
1 40 (16.13%) Firewall
2 25 (10.08%) VPN
3 10 (4.03%) 5G
3 10 (4.03%) DHCP
3 10 (4.03%) DNS
3 10 (4.03%) IPsec
3 10 (4.03%) LAN
3 10 (4.03%) WAN
4 9 (3.63%) BGP
5 6 (2.42%) Cisco ISE
5 6 (2.42%) Network Security
6 5 (2.02%) Internet
6 5 (2.02%) Intrusion Detection
6 5 (2.02%) NGFW
6 5 (2.02%) OSPF
6 5 (2.02%) SNMP
6 5 (2.02%) SSL
6 5 (2.02%) TCP/IP
6 5 (2.02%) VLAN
6 5 (2.02%) Wireless
Database & Business Intelligence
1 46 (18.55%) PostgreSQL
2 45 (18.15%) NoSQL
3 29 (11.69%) Relational Database
4 8 (3.23%) MySQL
5 6 (2.42%) Elasticsearch
5 6 (2.42%) InfluxDB
5 6 (2.42%) MongoDB
6 5 (2.02%) MariaDB
7 3 (1.21%) SQL Server
8 2 (0.81%) Big Data
8 2 (0.81%) Hadoop
8 2 (0.81%) Redis
9 1 (0.40%) Amazon Athena
9 1 (0.40%) Amazon RDS
9 1 (0.40%) Amazon Redshift
9 1 (0.40%) BigQuery
9 1 (0.40%) DynamoDB
9 1 (0.40%) Oracle Database
9 1 (0.40%) SAP HANA
Development Applications
1 97 (39.11%) Jenkins
2 92 (37.10%) Git
3 18 (7.26%) GitLab
4 13 (5.24%) JIRA
4 13 (5.24%) JUnit
5 11 (4.44%) Subversion
5 11 (4.44%) Vagrant
6 10 (4.03%) Trac
7 6 (2.42%) Robot Framework
7 6 (2.42%) Sonatype Nexus
8 5 (2.02%) Selenium
8 5 (2.02%) Visual Studio
9 4 (1.61%) Cucumber
9 4 (1.61%) MSI
9 4 (1.61%) SonarQube
9 4 (1.61%) TeamCity
10 3 (1.21%) Team Foundation Server
11 2 (0.81%) Postman
11 2 (0.81%) SoapUI
11 2 (0.81%) TestNG
General
1 41 (16.53%) Aerospace
2 37 (14.92%) Social Skills
3 23 (9.27%) Public Sector
4 10 (4.03%) Telecoms
5 8 (3.23%) Finance
6 6 (2.42%) Analytical Skills
7 5 (2.02%) Legal
8 3 (1.21%) Organisational Skills
8 3 (1.21%) Presentation Skills
9 1 (0.40%) Inclusion and Diversity
9 1 (0.40%) Influencing Skills
9 1 (0.40%) Pharmaceutical
Job Titles
1 48 (19.35%) Developer
2 45 (18.15%) Java Developer
3 38 (15.32%) DevOps Engineer
4 37 (14.92%) Senior
5 22 (8.87%) Network Engineer
6 17 (6.85%) Infrastructure Engineer
6 17 (6.85%) Linux Engineer
7 16 (6.45%) SC Cleared Java Developer
7 16 (6.45%) Software Engineer
8 15 (6.05%) Lead
8 15 (6.05%) Senior Network Engineer
9 12 (4.84%) Development Manager
9 12 (4.84%) Senior Developer
9 12 (4.84%) Team Leader
10 11 (4.44%) Configuration Manager
10 11 (4.44%) Integration Engineer
11 10 (4.03%) Full Stack Developer
11 10 (4.03%) SC Cleared Software Engineer
11 10 (4.03%) Senior Java Developer
11 10 (4.03%) Software Manager
Libraries, Frameworks & Software Standards
1 47 (18.95%) Elastic Stack
2 45 (18.15%) Spring Boot
3 43 (17.34%) REST
3 43 (17.34%) Spring
4 42 (16.94%) Node.js
5 40 (16.13%) AngularJS
6 37 (14.92%) Web Services
7 36 (14.52%) Apache Camel
8 30 (12.10%) JSON
9 29 (11.69%) XML
10 28 (11.29%) .NET
11 12 (4.84%) RESTful
12 11 (4.44%) Middleware
13 10 (4.03%) RabbitMQ
13 10 (4.03%) SOAP
14 8 (3.23%) J2EE
14 8 (3.23%) YAML
15 7 (2.82%) Kafka
16 5 (2.02%) ASP.NET
17 3 (1.21%) HTML
Miscellaneous
1 37 (14.92%) Distributed Systems
2 26 (10.48%) Data Centre
3 16 (6.45%) PKI
4 6 (2.42%) Hybrid Cloud
4 6 (2.42%) Public Cloud
5 5 (2.02%) Algorithms
5 5 (2.02%) Data Structures
5 5 (2.02%) Legacy Systems
6 3 (1.21%) Product Ownership
7 1 (0.40%) EMC VNX
7 1 (0.40%) Enterprise Software
7 1 (0.40%) Management Information System
7 1 (0.40%) Operational Technology
7 1 (0.40%) Self-Motivation
Operating Systems
1 100 (40.32%) Linux
2 55 (22.18%) Windows
3 31 (12.50%) CentOS
4 30 (12.10%) Red Hat Enterprise Linux
5 19 (7.66%) Windows Server
6 16 (6.45%) Android
7 13 (5.24%) Windows Server 2019
8 12 (4.84%) Ubuntu
9 6 (2.42%) Windows Server 2012
9 6 (2.42%) Windows Server 2016
10 5 (2.02%) Apple iOS
10 5 (2.02%) Data ONTAP
10 5 (2.02%) Windows 10
11 2 (0.81%) Unix
12 1 (0.40%) Debian
12 1 (0.40%) Rocky
12 1 (0.40%) Solaris
Processes & Methodologies
1 148 (59.68%) DevOps
2 119 (47.98%) Agile
3 65 (26.21%) Microservices
4 58 (23.39%) CI/CD
5 54 (21.77%) Problem-Solving
6 52 (20.97%) Actionable Insight
6 52 (20.97%) Scrum
7 46 (18.55%) Collaborative Working
7 46 (18.55%) Kanban
8 45 (18.15%) Project Management
9 43 (17.34%) TDD
10 42 (16.94%) BDD
11 41 (16.53%) Test Automation
12 38 (15.32%) Software Engineering
13 36 (14.52%) Configuration Management
13 36 (14.52%) Infrastructure as Code
14 27 (10.89%) Computer Science
15 25 (10.08%) BPEL
16 24 (9.68%) Mentoring
17 22 (8.87%) Continuous Integration
Programming Languages
1 107 (43.15%) Python
2 64 (25.81%) Java
3 59 (23.79%) PowerShell
4 56 (22.58%) JavaScript
5 51 (20.56%) SQL
6 19 (7.66%) Bash
7 18 (7.26%) C#
8 15 (6.05%) Shell Script
9 13 (5.24%) C++
10 11 (4.44%) Kotlin
11 7 (2.82%) Perl
12 6 (2.42%) C
12 6 (2.42%) Go
13 5 (2.02%) AWK
14 4 (1.61%) sed
15 3 (1.21%) Bicep
16 2 (0.81%) PHP
16 2 (0.81%) PL/SQL
17 1 (0.40%) Groovy
17 1 (0.40%) Korn
Qualifications
1 123 (49.60%) Security Cleared
2 104 (41.94%) SC Cleared
3 34 (13.71%) Degree
4 26 (10.48%) Computer Science Degree
5 23 (9.27%) DV Cleared
6 12 (4.84%) AWS Certification
6 12 (4.84%) Azure Certification
7 11 (4.44%) CCIE
7 11 (4.44%) Cisco Certification
8 10 (4.03%) ITIL Foundation Certificate
9 6 (2.42%) CCNP
9 6 (2.42%) JNCIE
10 4 (1.61%) PhD
11 3 (1.21%) Master's Degree
12 1 (0.40%) AWS Certified Solutions Architect
12 1 (0.40%) AWS Certified SysOps Administrator
12 1 (0.40%) BPSS Clearance
12 1 (0.40%) Microsoft Certification
12 1 (0.40%) RHCE
12 1 (0.40%) RHCSA
Quality Assurance & Compliance
1 7 (2.82%) QA
2 3 (1.21%) SLA
3 2 (0.81%) Cyber Essentials
3 2 (0.81%) Cyber Essentials PLUS
3 2 (0.81%) ISO/IEC 27001
3 2 (0.81%) PCI DSS
System Software
1 94 (37.90%) Docker
2 42 (16.94%) Hyper-V
3 25 (10.08%) Active Directory
4 19 (7.66%) VMware Infrastructure
5 12 (4.84%) Virtual Machines
6 10 (4.03%) NFS
6 10 (4.03%) pfSense
7 5 (2.02%) Citrix Hypervisor
8 2 (0.81%) Firmware
8 2 (0.81%) VMware ESXi
9 1 (0.40%) Oracle RAC
9 1 (0.40%) XenApp
9 1 (0.40%) XenDesktop
Systems Management
1 119 (47.98%) Terraform
2 98 (39.52%) Kubernetes
3 21 (8.47%) ZABBIX
4 19 (7.66%) Puppet
5 15 (6.05%) Rancher
6 13 (5.24%) Grafana
7 10 (4.03%) Microsoft Data Protection Manager
7 10 (4.03%) SCDPM
8 8 (3.23%) Prometheus
9 7 (2.82%) Docker Swarm
9 7 (2.82%) Kibana
10 6 (2.42%) vCenter Server
11 5 (2.02%) Red Hat Spacewalk
12 4 (1.61%) WMI
13 3 (1.21%) Microsoft Intune
13 3 (1.21%) Progress Chef
14 1 (0.40%) EMC NetWorker
14 1 (0.40%) Red Hat Satellite
14 1 (0.40%) Salt
14 1 (0.40%) yum
Vendors
1 47 (18.95%) VMware
2 35 (14.11%) WSO2
3 27 (10.89%) Microsoft
4 23 (9.27%) Juniper
5 21 (8.47%) Fortinet
6 15 (6.05%) Cisco
7 11 (4.44%) Palo Alto
7 11 (4.44%) Veeam
8 10 (4.03%) McAfee
8 10 (4.03%) Xilinx
9 7 (2.82%) Red Hat
10 6 (2.42%) Aruba
11 5 (2.02%) NetApp
11 5 (2.02%) Oracle
11 5 (2.02%) SolidFire
12 2 (0.81%) EMC
12 2 (0.81%) IBM
12 2 (0.81%) ServiceNow
12 2 (0.81%) Splunk
13 1 (0.40%) AppDynamics