AWS Jobs in the South East

Amazon Web Services (AWS)
England > South East

The following table provides summary statistics for permanent job vacancies advertised in the South East with a requirement for AWS skills. Included is a benchmarking guide to the salaries offered in vacancies that have cited AWS over the 6 months to 7 December 2023 with a comparison to the same period in the previous 2 years.

6 months to
7 Dec 2023
Same period 2022 Same period 2021
Rank 22 16 11
Rank change year-on-year -6 -5 +6
Permanent jobs citing AWS 671 1,864 2,871
As % of all permanent jobs advertised in the South East 8.77% 10.97% 15.76%
As % of the Cloud Services category 24.34% 30.21% 36.01%
Number of salaries quoted 493 1,123 1,920
10th Percentile £42,500 £42,500 £41,250
25th Percentile £51,750 £52,500 £47,500
Median annual salary (50th Percentile) £65,000 £65,000 £60,000
Median % change year-on-year - +8.33% -
75th Percentile £80,000 £81,750 £77,500
90th Percentile £89,800 £90,000 £92,500
England median annual salary £72,500 £75,000 £70,000
% change year-on-year -3.33% +7.14% +7.69%

All Cloud Skills
South East

AWS is in the Cloud Services category. The following table is for comparison with the above and provides summary statistics for all permanent job vacancies advertised in the South East with a requirement for cloud computing skills.

Permanent vacancies with a requirement for cloud computing skills 2,757 6,171 7,972
As % of all permanent jobs advertised in the South East 36.05% 36.32% 43.76%
Number of salaries quoted 2,147 4,517 5,800
10th Percentile £29,000 £30,000 £31,250
25th Percentile £39,690 £41,250 £41,250
Median annual salary (50th Percentile) £52,500 £57,500 £55,000
Median % change year-on-year -8.70% +4.55% -
75th Percentile £68,750 £75,000 £70,000
90th Percentile £82,500 £85,000 £82,500
England median annual salary £62,500 £65,000 £60,000
% change year-on-year -3.85% +8.33% -

AWS
Job Vacancy Trend in the South East

Job postings citing AWS as a proportion of all IT jobs advertised in the South East.
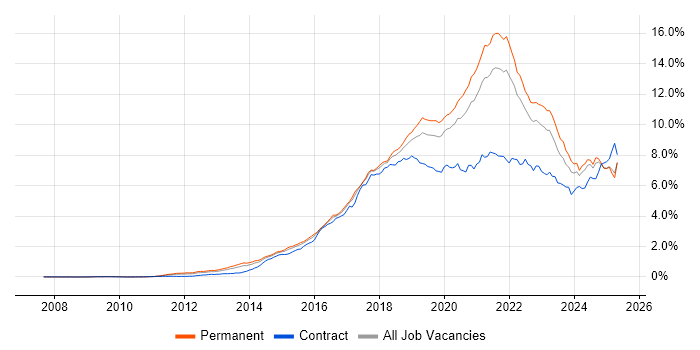
Job vacancy trend for AWS in the South East

AWS
Salary Trend in the South East

3-month moving average salary quoted in jobs citing AWS in the South East.

Salary trend for AWS in the South East

AWS
Salary Histogram in the South East

Salary distribution for jobs citing AWS in the South East over the 6 months to 7 December 2023.

Salary histogram for AWS in the South East

AWS
Job Locations in the South East

The table below looks at the demand and provides a guide to the median salaries quoted in IT jobs citing AWS within the South East region over the 6 months to 7 December 2023. The 'Rank Change' column provides an indication of the change in demand within each location based on the same 6 month period last year.

Location Rank Change
on Same Period
Last Year
Matching
Permanent
IT Job Ads
Median Salary
Past 6 Months
Median Salary
% Change
on Same Period
Last Year
Live
Jobs
Thames Valley -6 334 £65,000 - 116
Berkshire -5 209 £70,000 +3.70% 51
Hampshire -7 178 £65,000 - 55
Oxfordshire +15 76 £55,000 -8.33% 43
Buckinghamshire -15 49 £65,000 -7.14% 22
East Sussex -11 48 £65,000 +13.04% 18
Surrey -23 44 £57,500 -17.86% 26
Kent -14 31 £65,000 +8.33% 30
West Sussex +24 20 £65,000 +13.04% 9
Middlesex +4 2 £91,250 +7.35%
M4 Corridor - 1 £95,000 -
AWS
England

AWS
Co-occurring Skills and Capabilities in the South East by Category

The follow tables expand on the table above by listing co-occurrences grouped by category. The same employment type, locality and period is covered with up to 20 co-occurrences shown in each of the following categories:

Application Platforms
1 22 (3.28%) SharePoint
2 17 (2.53%) OpenStack
3 15 (2.24%) Apache
3 15 (2.24%) Apache Spark
4 13 (1.94%) IIS
5 11 (1.64%) MS Exchange
5 11 (1.64%) Red Hat Fuse
5 11 (1.64%) Tomcat
6 9 (1.34%) Confluence
6 9 (1.34%) JBoss
7 8 (1.19%) nginx
8 7 (1.04%) CMS
8 7 (1.04%) WebSphere
9 4 (0.60%) Umbraco
10 3 (0.45%) Apache Airflow
11 2 (0.30%) Alfresco
11 2 (0.30%) Documentum
11 2 (0.30%) FileNet
12 1 (0.15%) Jupyter
12 1 (0.15%) Luigi
Applications
1 7 (1.04%) AutoCAD
1 7 (1.04%) PTC Creo
1 7 (1.04%) SOLIDWORKS
2 5 (0.75%) Microsoft Office
3 4 (0.60%) Microsoft Project
4 3 (0.45%) MS Visio
5 2 (0.30%) Adobe Creative Suite
5 2 (0.30%) Microsoft Excel
Business Applications
1 3 (0.45%) IBM Planning Analytics
1 3 (0.45%) Unit4 Business World
Cloud Services
1 344 (51.27%) Azure
2 111 (16.54%) GCP
2 111 (16.54%) Serverless
3 70 (10.43%) SaaS
4 55 (8.20%) AWS Lambda
5 50 (7.45%) Amazon EKS
5 50 (7.45%) Cloud Computing
6 43 (6.41%) Amazon ECS
6 43 (6.41%) Microsoft 365
7 41 (6.11%) GitHub
8 32 (4.77%) Azure DevOps
9 31 (4.62%) AWS CloudFormation
10 28 (4.17%) PaaS
11 26 (3.87%) Amazon S3
12 24 (3.58%) IaaS
13 23 (3.43%) Amazon EC2
14 22 (3.28%) Amazon SQS
15 21 (3.13%) Entra ID
16 14 (2.09%) OpenShift
17 13 (1.94%) Snowflake
Communications & Networking
1 35 (5.22%) DNS
2 31 (4.62%) Firewall
3 30 (4.47%) VPN
4 29 (4.32%) DHCP
5 28 (4.17%) Internet
6 27 (4.02%) LAN
6 27 (4.02%) WAN
7 24 (3.58%) TCP/IP
8 16 (2.38%) SAN
9 15 (2.24%) Network Security
10 12 (1.79%) Wireless
11 11 (1.64%) Structured Cabling
12 10 (1.49%) VoIP
13 9 (1.34%) BGP
14 8 (1.19%) HTTP
15 7 (1.04%) OSPF
15 7 (1.04%) Wireshark
16 6 (0.89%) IPsec
17 5 (0.75%) IPv4
17 5 (0.75%) Wi-Fi
Database & Business Intelligence
1 70 (10.43%) PostgreSQL
2 55 (8.20%) MySQL
3 48 (7.15%) NoSQL
4 41 (6.11%) Relational Database
5 39 (5.81%) SQL Server
6 38 (5.66%) Amazon RDS
7 29 (4.32%) MongoDB
8 25 (3.73%) Oracle Database
9 24 (3.58%) DynamoDB
10 21 (3.13%) Oracle Database 11g
11 20 (2.98%) Data Warehouse
12 18 (2.68%) MariaDB
13 17 (2.53%) Big Data
14 14 (2.09%) Elasticsearch
15 13 (1.94%) Amazon Redshift
16 12 (1.79%) Hadoop
17 9 (1.34%) Power BI
18 8 (1.19%) Amazon Athena
19 7 (1.04%) SAP HANA
20 5 (0.75%) Redis
Development Applications
1 105 (15.65%) Git
2 102 (15.20%) Jenkins
3 59 (8.79%) JIRA
4 37 (5.51%) GitLab
5 23 (3.43%) Maven
6 20 (2.98%) Cucumber
7 17 (2.53%) SonarQube
8 16 (2.38%) JUnit
9 15 (2.24%) Selenium
10 12 (1.79%) Bitbucket
10 12 (1.79%) JMeter
11 11 (1.64%) Artifactory
12 10 (1.49%) Bitbucket Server
12 10 (1.49%) CircleCI
12 10 (1.49%) Serenity BDD
12 10 (1.49%) SoapUI
13 9 (1.34%) Gradle
14 8 (1.19%) git-flow
14 8 (1.19%) Mockito
15 7 (1.04%) Chocolatey
General
1 138 (20.57%) Social Skills
2 80 (11.92%) Finance
3 48 (7.15%) Public Sector
4 39 (5.81%) Analytical Skills
5 30 (4.47%) Telecoms
6 22 (3.28%) Retail
7 21 (3.13%) Financial Institution
8 14 (2.09%) Publishing
9 13 (1.94%) Automotive
9 13 (1.94%) Aviation
9 13 (1.94%) Manufacturing
9 13 (1.94%) Marketing
10 12 (1.79%) Presentation Skills
11 11 (1.64%) Banking
12 10 (1.49%) Legal
13 9 (1.34%) Aerospace
14 7 (1.04%) Games
15 6 (0.89%) Inclusion and Diversity
15 6 (0.89%) Organisational Skills
15 6 (0.89%) Tech for Good
Job Titles
1 187 (27.87%) Developer
2 142 (21.16%) Senior
3 83 (12.37%) Architect
4 78 (11.62%) DevOps Engineer
5 70 (10.43%) Lead
6 61 (9.09%) Java Developer
7 59 (8.79%) Senior Developer
8 48 (7.15%) Solutions Architect
9 36 (5.37%) Software Engineer
10 33 (4.92%) Infrastructure Engineer
11 29 (4.32%) Full Stack Developer
12 23 (3.43%) AWS Engineer
12 23 (3.43%) Senior Java Developer
13 21 (3.13%) .NET Developer
14 20 (2.98%) Software Developer
14 20 (2.98%) Technical Architect
15 19 (2.83%) Lead Developer
15 19 (2.83%) PHP Developer
15 19 (2.83%) Team Leader
16 18 (2.68%) AWS DevOps
Libraries, Frameworks & Software Standards
1 77 (11.48%) Node.js
2 72 (10.73%) REST
3 66 (9.84%) Spring
4 64 (9.54%) AngularJS
5 63 (9.39%) .NET
5 63 (9.39%) React
6 46 (6.86%) Web Services
7 45 (6.71%) SOAP
8 42 (6.26%) RESTful
9 41 (6.11%) HTML
9 41 (6.11%) Spring Boot
10 39 (5.81%) Elastic Stack
11 36 (5.37%) Kafka
12 33 (4.92%) Vue
13 31 (4.62%) CSS
13 31 (4.62%) RabbitMQ
14 29 (4.32%) XML
15 27 (4.02%) jQuery
16 23 (3.43%) JSON
17 20 (2.98%) Laravel
Miscellaneous
1 36 (5.37%) Distributed Systems
2 35 (5.22%) Public Cloud
3 30 (4.47%) Greenfield Project
4 29 (4.32%) Product Ownership
5 14 (2.09%) Cloud Native
6 13 (1.94%) Enterprise Software
6 13 (1.94%) IoT
6 13 (1.94%) NHS
7 12 (1.79%) Data Centre
8 11 (1.64%) PKI
9 9 (1.34%) Private Cloud
9 9 (1.34%) Self-Motivation
10 7 (1.04%) Data Structures
10 7 (1.04%) Management Information System
10 7 (1.04%) Operational Technology
10 7 (1.04%) Video\Live Streaming
11 6 (0.89%) Digital Media
12 5 (0.75%) CCTV
13 4 (0.60%) Clustering
13 4 (0.60%) Robotics
Operating Systems
1 126 (18.78%) Linux
2 70 (10.43%) Windows
3 39 (5.81%) Windows Server
4 14 (2.09%) Windows Server 2012
5 10 (1.49%) Ubuntu
6 9 (1.34%) Red Hat Enterprise Linux
7 7 (1.04%) Android
7 7 (1.04%) Apple iOS
7 7 (1.04%) CentOS
8 5 (0.75%) Debian
8 5 (0.75%) Windows Server 2016
9 4 (0.60%) Windows 10
10 3 (0.45%) Unix
10 3 (0.45%) VMS
11 2 (0.30%) Windows Server 2019
12 1 (0.15%) Windows 7
Processes & Methodologies
1 244 (36.36%) Agile
2 213 (31.74%) DevOps
3 150 (22.35%) Microservices
4 142 (21.16%) CI/CD
5 134 (19.97%) Problem-Solving
6 87 (12.97%) Software Engineering
7 81 (12.07%) Scrum
8 80 (11.92%) Infrastructure as Code
9 70 (10.43%) Unit Testing
10 67 (9.99%) Actionable Insight
11 65 (9.69%) TDD
12 64 (9.54%) Full Stack Development
13 63 (9.39%) Migration
14 61 (9.09%) Artificial Intelligence
15 54 (8.05%) Mentoring
16 53 (7.90%) Computer Science
17 50 (7.45%) Test Automation
18 47 (7.00%) Analytics
18 47 (7.00%) Containerisation
19 46 (6.86%) Machine Learning
Programming Languages
1 198 (29.51%) Python
2 176 (26.23%) Java
3 164 (24.44%) SQL
4 150 (22.35%) JavaScript
5 69 (10.28%) C#
6 48 (7.15%) PowerShell
7 40 (5.96%) Bash
8 38 (5.66%) PHP
8 38 (5.66%) TypeScript
9 32 (4.77%) Go
10 24 (3.58%) PL/SQL
11 20 (2.98%) C++
11 20 (2.98%) Shell Script
12 19 (2.83%) Perl
13 17 (2.53%) Groovy
14 15 (2.24%) Ruby
15 9 (1.34%) C
16 7 (1.04%) MATLAB
16 7 (1.04%) R
16 7 (1.04%) T-SQL
Qualifications
1 121 (18.03%) Security Cleared
2 93 (13.86%) SC Cleared
3 76 (11.33%) Degree
4 40 (5.96%) AWS Certification
5 32 (4.77%) Computer Science Degree
6 24 (3.58%) Azure Certification
7 19 (2.83%) DV Cleared
8 13 (1.94%) TOGAF Certification
9 9 (1.34%) AWS Certified Solutions Architect
10 8 (1.19%) MCSE
10 8 (1.19%) Microsoft Certification
11 7 (1.04%) DBS Check
11 7 (1.04%) Master's Degree
11 7 (1.04%) MCSA
12 5 (0.75%) AWS Certified DevOps Engineer
12 5 (0.75%) AWS Certified SysOps Administrator
12 5 (0.75%) PhD
13 4 (0.60%) CCNA
13 4 (0.60%) Cisco Certification
13 4 (0.60%) CISSP
Quality Assurance & Compliance
1 23 (3.43%) QA
2 12 (1.79%) ISO/IEC 27001
3 8 (1.19%) Cyber Essentials
4 6 (0.89%) SLA
5 5 (0.75%) GDPR
6 3 (0.45%) Data Quality
7 2 (0.30%) Accessibility
7 2 (0.30%) Government Security Classifications
7 2 (0.30%) NCSC
7 2 (0.30%) NIST
8 1 (0.15%) PCI DSS
8 1 (0.15%) PMO
8 1 (0.15%) SOC 2
8 1 (0.15%) Software Quality Assurance
System Software
1 154 (22.95%) Docker
2 49 (7.30%) Active Directory
3 37 (5.51%) VMware Infrastructure
4 33 (4.92%) Hyper-V
5 9 (1.34%) vSphere
6 4 (0.60%) Terminal Services
7 3 (0.45%) VMware NSX
8 2 (0.30%) Postfix
8 2 (0.30%) Virtual Machines
8 2 (0.30%) Virtual Servers
8 2 (0.30%) VMware ESXi
9 1 (0.15%) Firmware
9 1 (0.15%) Kamailio
9 1 (0.15%) XenApp
9 1 (0.15%) XenDesktop
Systems Management
1 147 (21.91%) Kubernetes
2 138 (20.57%) Terraform
3 87 (12.97%) Ansible
4 20 (2.98%) SCCM
5 15 (2.24%) Puppet
6 13 (1.94%) Grafana
7 11 (1.64%) Active Directory Federation Services
8 9 (1.34%) Microsoft Intune
9 8 (1.19%) Icinga
9 8 (1.19%) Progress Chef
10 7 (1.04%) FortiGate
10 7 (1.04%) SCOM
11 6 (0.89%) Microsoft Clustering
12 5 (0.75%) Kibana
12 5 (0.75%) Kustomize
12 5 (0.75%) Packer
13 4 (0.60%) Consul
13 4 (0.60%) Rancher
14 3 (0.45%) Computer Emergency Response Teams
14 3 (0.45%) Prometheus
Vendors
1 99 (14.75%) Microsoft
2 54 (8.05%) VMware
3 48 (7.15%) Oracle
4 29 (4.32%) Cisco
5 27 (4.02%) IBM
6 21 (3.13%) Google
6 21 (3.13%) Veeam
7 16 (2.38%) WSO2
8 14 (2.09%) Juniper
9 13 (1.94%) Fortinet
9 13 (1.94%) HP
9 13 (1.94%) Red Hat
10 12 (1.79%) Splunk
11 11 (1.64%) Databricks
11 11 (1.64%) Mitel
11 11 (1.64%) Nimble Storage
11 11 (1.64%) Zerto
12 10 (1.49%) AppDynamics
12 10 (1.49%) Atlassian
12 10 (1.49%) SAP