GCP Jobs in the South East

Google Cloud Platform (GCP)
England > South East

The table below provides summary statistics for permanent job vacancies advertised in the South East requiring GCP skills. It includes a benchmarking guide to the annual salaries offered in vacancies that cited GCP over the 6 months leading up to 26 July 2024, comparing them to the same period in the previous two years.

6 months to
26 Jul 2024
Same period 2023 Same period 2022
Rank 166 122 113
Rank change year-on-year -44 -9 -13
Permanent jobs citing GCP 224 316 679
As % of all permanent jobs advertised in the South East 1.48% 2.73% 3.08%
As % of the Cloud Services category 5.22% 7.44% 7.89%
Number of salaries quoted 123 189 220
10th Percentile £42,500 £46,250 £41,250
25th Percentile £49,375 £55,000 £48,250
Median annual salary (50th Percentile) £60,000 £75,000 £66,250
Median % change year-on-year -20.00% +13.21% +6.00%
75th Percentile £81,500 £92,500 £80,000
90th Percentile £96,250 £100,000 £90,000
England median annual salary £85,000 £80,000 £80,000
% change year-on-year +6.25% - +6.67%

All Cloud Skills
South East

GCP falls under the Cloud Services category. For comparison with the information above, the following table provides summary statistics for all permanent job vacancies requiring cloud computing skills in the South East.

Permanent vacancies with a requirement for cloud computing skills 4,295 4,248 8,606
As % of all permanent jobs advertised in the South East 28.46% 36.66% 39.00%
Number of salaries quoted 3,085 3,221 5,536
10th Percentile £29,100 £30,000 £30,625
25th Percentile £40,000 £41,250 £41,250
Median annual salary (50th Percentile) £52,500 £57,500 £55,000
Median % change year-on-year -8.70% +4.55% +1.85%
75th Percentile £67,500 £74,750 £75,000
90th Percentile £82,500 £87,500 £85,000
England median annual salary £60,000 £65,000 £62,500
% change year-on-year -7.69% +4.00% +4.17%

GCP
Job Vacancy Trend in the South East

Job postings citing GCP as a proportion of all IT jobs advertised in the South East.
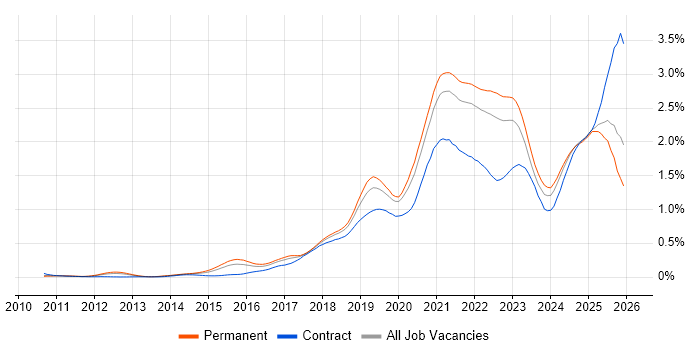
Job vacancy trend for GCP in the South East

GCP
Salary Trend in the South East

3-month moving average salary quoted in jobs citing GCP in the South East.

Salary trend for GCP in the South East

GCP
Salary Histogram in the South East

Salary distribution for jobs citing GCP in the South East over the 6 months to 26 July 2024.

Salary histogram for GCP in the South East

GCP
Job Locations in the South East

The table below looks at the demand and provides a guide to the median salaries quoted in IT jobs citing GCP within the South East region over the 6 months to 26 July 2024. The 'Rank Change' column provides an indication of the change in demand within each location based on the same 6 month period last year.

Location Rank Change
on Same Period
Last Year
Matching
Permanent
IT Job Ads
Median Salary
Past 6 Months
Median Salary
% Change
on Same Period
Last Year
Live
Jobs
Thames Valley -7 93 £57,004 -26.45% 5
Hampshire -45 47 £65,000 +4.00% 17
Oxfordshire +13 41 £47,500 -26.92% 2
Kent -7 34 £50,000 -23.08% 1
Berkshire -50 29 £80,000 +3.23% 3
Surrey -22 27 £87,500 +16.67% 1
Buckinghamshire +13 23 £33,750 -59.09%
East Sussex +23 19 £52,500 -38.24% 1
West Sussex -7 2 £48,668 -42.74% 4
Middlesex -16 1 - -
GCP
England

GCP
Co-occurring Skills and Capabilities in the South East by Category

The follow tables expand on the table above by listing co-occurrences grouped by category. The same employment type, locality and period is covered with up to 20 co-occurrences shown in each of the following categories:

Application Platforms
1 5 (2.23%) nginx
2 3 (1.34%) Apache Spark
3 2 (0.89%) Microsoft Exchange
4 1 (0.45%) Apache
4 1 (0.45%) Confluence
4 1 (0.45%) SharePoint
4 1 (0.45%) WordPress
Applications
1 5 (2.23%) Simulink
2 1 (0.45%) Revit
2 1 (0.45%) Spreadsheet
Cloud Services
1 164 (73.21%) AWS
2 149 (66.52%) Azure
3 25 (11.16%) Azure DevOps
4 14 (6.25%) GitHub
5 12 (5.36%) SaaS
6 10 (4.46%) Cloud Computing
6 10 (4.46%) Microsoft 365
7 8 (3.57%) DigitalOcean
8 7 (3.13%) Amazon S3
9 6 (2.68%) dbt
10 4 (1.79%) Amazon EC2
10 4 (1.79%) Amazon ELB
10 4 (1.79%) GitHub Actions
10 4 (1.79%) OpenShift
10 4 (1.79%) Serverless
10 4 (1.79%) Virtual Private Cloud
11 3 (1.34%) AWS Lambda
11 3 (1.34%) Snowflake
12 2 (0.89%) Google Analytics
12 2 (0.89%) Google Sheets
Communications & Networking
1 12 (5.36%) Firewall
2 10 (4.46%) VPN
3 9 (4.02%) Network Security
4 5 (2.23%) Reverse Proxy
4 5 (2.23%) VoIP
4 5 (2.23%) WAN
5 4 (1.79%) Asterisk PBX
5 4 (1.79%) MQTT
5 4 (1.79%) PBX
5 4 (1.79%) TCP/IP
6 3 (1.34%) LAN
6 3 (1.34%) VLAN
7 2 (0.89%) MPLS
8 1 (0.45%) BGP
8 1 (0.45%) DNS
8 1 (0.45%) EIGRP
8 1 (0.45%) IPsec
8 1 (0.45%) OSPF
8 1 (0.45%) SAN
8 1 (0.45%) Sourcefire
Database & Business Intelligence
1 83 (37.05%) BigQuery
2 82 (36.61%) Looker
3 47 (20.98%) Data Warehouse
4 33 (14.73%) MySQL
5 11 (4.91%) SQL Server
6 10 (4.46%) Relational Database
7 7 (3.13%) NoSQL
8 6 (2.68%) Big Data
9 5 (2.23%) Amazon RDS
9 5 (2.23%) PostgreSQL
10 3 (1.34%) Amazon Athena
10 3 (1.34%) Data Lake
10 3 (1.34%) Hadoop
10 3 (1.34%) SQL Server Reporting Services
11 2 (0.89%) Amazon Redshift
11 2 (0.89%) Data Mining
11 2 (0.89%) DynamoDB
11 2 (0.89%) Redis
11 2 (0.89%) Tableau
12 1 (0.45%) Presto
Development Applications
1 34 (15.18%) Git
2 10 (4.46%) PHPUnit
2 10 (4.46%) Selenium
3 7 (3.13%) Jenkins
4 2 (0.89%) Burp Suite
4 2 (0.89%) GitLab
4 2 (0.89%) JIRA
4 2 (0.89%) Metasploit
5 1 (0.45%) SonarQube
5 1 (0.45%) TeamCity
5 1 (0.45%) Terragrunt
General
1 89 (39.73%) Analytical Skills
2 26 (11.61%) Finance
3 25 (11.16%) Billing
4 24 (10.71%) Social Skills
5 12 (5.36%) Presentation Skills
6 11 (4.91%) Telecoms
7 6 (2.68%) Public Sector
8 5 (2.23%) Advertising
9 3 (1.34%) Inclusion and Diversity
9 3 (1.34%) Marketing
10 2 (0.89%) Law
10 2 (0.89%) Manufacturing
10 2 (0.89%) Organisational Skills
10 2 (0.89%) Retail
11 1 (0.45%) Documentation Skills
11 1 (0.45%) Retail Finance
Job Titles
1 50 (22.32%) Architect
2 33 (14.73%) Data Architect
3 32 (14.29%) Principal Engineer
4 30 (13.39%) Developer
5 29 (12.95%) Data Engineer
6 27 (12.05%) Data Manager
6 27 (12.05%) Engineering Manager
6 27 (12.05%) Principal Data Engineer
6 27 (12.05%) Senior
7 24 (10.71%) Platform Engineer
8 14 (6.25%) PHP Developer
8 14 (6.25%) Software Engineer
9 13 (5.80%) Lead
10 12 (5.36%) Senior Developer
11 10 (4.46%) Administrator
11 10 (4.46%) IT Administrator
11 10 (4.46%) IT Systems Administrator
11 10 (4.46%) Systems Administrator
12 9 (4.02%) DevOps Engineer
12 9 (4.02%) Network Engineer
Libraries, Frameworks & Software Standards
1 21 (9.38%) CSS
1 21 (9.38%) HTML
2 14 (6.25%) React
3 12 (5.36%) jQuery
4 11 (4.91%) LAMP
5 10 (4.46%) CSS3
5 10 (4.46%) HTML5
5 10 (4.46%) Laravel
6 9 (4.02%) Node.js
6 9 (4.02%) Symfony
7 8 (3.57%) AngularJS
7 8 (3.57%) RESTful
8 6 (2.68%) Kafka
9 5 (2.23%) EDI
9 5 (2.23%) gRPC
10 4 (1.79%) .NET
10 4 (1.79%) GraphQL
10 4 (1.79%) LEMP Stack
10 4 (1.79%) Sequelize
10 4 (1.79%) Spring
Miscellaneous
1 50 (22.32%) Self-Motivation
2 33 (14.73%) Product Ownership
3 11 (4.91%) Management Information System
4 10 (4.46%) Legacy Systems
4 10 (4.46%) Public Cloud
5 9 (4.02%) Cybercrime
6 7 (3.13%) Greenfield Project
6 7 (3.13%) PKI
7 6 (2.68%) Algorithms
8 5 (2.23%) CAN bus
9 4 (1.79%) Analytical Mindset
9 4 (1.79%) Cloud Native
9 4 (1.79%) IoT
9 4 (1.79%) Mobile App
10 3 (1.34%) Data Centre
10 3 (1.34%) Distributed Computing
10 3 (1.34%) Security Posture
11 2 (0.89%) CUDA
11 2 (0.89%) Cyber Threat
11 2 (0.89%) Fat Client
Operating Systems
1 14 (6.25%) Linux
2 5 (2.23%) Windows
3 3 (1.34%) Unix
4 2 (0.89%) VMS
4 2 (0.89%) Windows Server
4 2 (0.89%) Windows Server 2016
5 1 (0.45%) Android
5 1 (0.45%) CentOS
5 1 (0.45%) Red Hat Enterprise Linux
5 1 (0.45%) Windows 10
5 1 (0.45%) Windows 7
5 1 (0.45%) Windows Server 2008
5 1 (0.45%) Windows Server 2019
Processes & Methodologies
1 109 (48.66%) Problem-Solving
2 79 (35.27%) Agile
3 78 (34.82%) Data Engineering
3 78 (34.82%) Platform Engineering
4 75 (33.48%) DevOps
5 70 (31.25%) Mentoring
6 51 (22.77%) Data Modelling
7 50 (22.32%) ETL
8 48 (21.43%) Data Pipeline
9 39 (17.41%) CI/CD
10 36 (16.07%) Scrum
11 35 (15.63%) Project Management
12 33 (14.73%) Data Architecture
12 33 (14.73%) Data Science
13 30 (13.39%) Data Security
14 29 (12.95%) Analytics
14 29 (12.95%) Software Engineering
15 26 (11.61%) Data Governance
15 26 (11.61%) Data Integration
16 25 (11.16%) Cybersecurity
Programming Languages
1 46 (20.54%) Python
2 27 (12.05%) PHP
3 26 (11.61%) JavaScript
4 18 (8.04%) Go
4 18 (8.04%) SQL
5 16 (7.14%) Bash
6 15 (6.70%) Java
7 14 (6.25%) C++
8 12 (5.36%) PowerShell
9 7 (3.13%) R
10 5 (2.23%) TypeScript
11 4 (1.79%) JSX
12 3 (1.34%) C
12 3 (1.34%) Scala
13 2 (0.89%) C-shell
13 2 (0.89%) Fortran
14 1 (0.45%) Bicep
14 1 (0.45%) C#
14 1 (0.45%) MATLAB
14 1 (0.45%) Rust
Qualifications
1 33 (14.73%) Degree
2 24 (10.71%) Security Cleared
3 23 (10.27%) SC Cleared
4 22 (9.82%) Computer Science Degree
5 14 (6.25%) DV Cleared
6 9 (4.02%) Master's Degree
7 7 (3.13%) Cisco Certification
8 6 (2.68%) AWS Certification
8 6 (2.68%) CCNA
8 6 (2.68%) CISSP
9 5 (2.23%) BPSS Clearance
10 3 (1.34%) AWS Certified Solutions Architect
10 3 (1.34%) Azure Certification
10 3 (1.34%) CESG Certified Professional
10 3 (1.34%) CISM
10 3 (1.34%) Network+ Certification
10 3 (1.34%) PCI QSA
11 2 (0.89%) CEH
11 2 (0.89%) CompTIA Security+
11 2 (0.89%) PhD
Quality Assurance & Compliance
1 45 (20.09%) GDPR
2 33 (14.73%) QA
3 26 (11.61%) Data Quality
4 9 (4.02%) ISO/IEC 27001
5 5 (2.23%) PCI DSS
6 4 (1.79%) NIST
7 3 (1.34%) NCSC
7 3 (1.34%) NIST 800
8 2 (0.89%) Accessibility
9 1 (0.45%) HIPAA
9 1 (0.45%) SOC 2
System Software
1 46 (20.54%) Docker
2 4 (1.79%) VMware Infrastructure
3 2 (0.89%) Hyper-V
3 2 (0.89%) KVM
4 1 (0.45%) Active Directory
4 1 (0.45%) vSphere
4 1 (0.45%) XenApp
Systems Management
1 24 (10.71%) Kubernetes
2 12 (5.36%) Ansible
3 10 (4.46%) Terraform
4 5 (2.23%) Puppet
5 2 (0.89%) Nagios
5 2 (0.89%) Nmap
6 1 (0.45%) EMC VPLEX
6 1 (0.45%) Grafana
6 1 (0.45%) Graphite
6 1 (0.45%) Netcool
6 1 (0.45%) Progress Chef
6 1 (0.45%) Prometheus
6 1 (0.45%) Salt
6 1 (0.45%) ZABBIX
Vendors
1 116 (51.79%) Google
2 12 (5.36%) Microsoft
3 9 (4.02%) Cisco
4 5 (2.23%) VMware
5 4 (1.79%) RedGate
5 4 (1.79%) Salesforce
6 3 (1.34%) Foundry
6 3 (1.34%) Palantir
7 2 (0.89%) Aruba
7 2 (0.89%) EMC
7 2 (0.89%) HP
7 2 (0.89%) IBM
7 2 (0.89%) Medallia
7 2 (0.89%) Meraki
7 2 (0.89%) Optimizely
7 2 (0.89%) Oracle
7 2 (0.89%) Palo Alto
7 2 (0.89%) Veeam
8 1 (0.45%) Citrix
8 1 (0.45%) Juniper