Kubernetes Jobs in the South East

Kubernetes (k8s)
England > South East

The table below provides summary statistics for permanent job vacancies advertised in the South East requiring Kubernetes skills. It includes a benchmarking guide to the annual salaries offered in vacancies that cited Kubernetes over the 6 months leading up to 1 May 2025, comparing them to the same period in the previous two years.

6 months to
1 May 2025
Same period 2024 Same period 2023
Rank 73 73 59
Rank change year-on-year 0 -14 -20
Permanent jobs citing Kubernetes 300 587 709
As % of all permanent jobs advertised in the South East 3.54% 3.52% 4.73%
As % of the Systems Management category 46.08% 34.15% 34.42%
Number of salaries quoted 171 471 476
10th Percentile £47,500 £49,000 £47,500
25th Percentile £56,250 £57,500 £55,000
Median annual salary (50th Percentile) £65,000 £70,000 £70,000
Median % change year-on-year -7.14% - -
75th Percentile £80,000 £86,000 £91,250
90th Percentile £95,000 £97,500 £101,875
England median annual salary £85,000 £77,500 £79,632
% change year-on-year +9.68% -2.68% +2.75%

All Systems Management Skills
South East

Kubernetes falls under the Systems Management category. For comparison with the information above, the following table provides summary statistics for all permanent job vacancies requiring systems management skills in the South East.

Permanent vacancies with a requirement for systems management skills 651 1,719 2,060
As % of all permanent jobs advertised in the South East 7.69% 10.30% 13.75%
Number of salaries quoted 406 1,292 1,251
10th Percentile £36,250 £31,375 £27,750
25th Percentile £47,000 £40,000 £38,725
Median annual salary (50th Percentile) £60,000 £55,000 £57,500
Median % change year-on-year +9.09% -4.35% -11.54%
75th Percentile £78,750 £72,125 £77,500
90th Percentile £87,500 £87,500 £92,500
England median annual salary £69,500 £60,000 £67,500
% change year-on-year +15.83% -11.11% -3.57%

Kubernetes
Job Vacancy Trend in the South East

Job postings citing Kubernetes as a proportion of all IT jobs advertised in the South East.
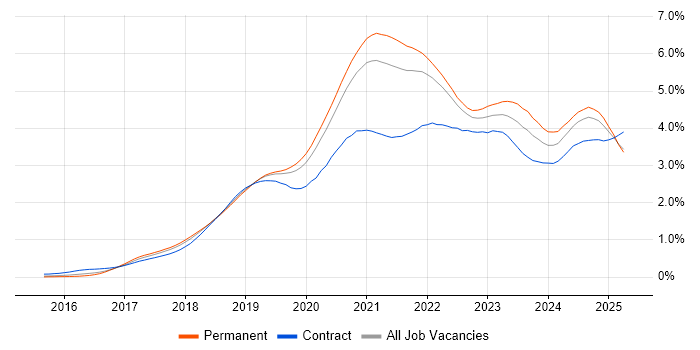
Job vacancy trend for Kubernetes in the South East

Kubernetes
Salary Trend in the South East

3-month moving average salary quoted in jobs citing Kubernetes in the South East.

Salary trend for Kubernetes in the South East

Kubernetes
Salary Histogram in the South East

Salary distribution for jobs citing Kubernetes in the South East over the 6 months to 1 May 2025.

Salary histogram for Kubernetes in the South East

Kubernetes
Job Locations in the South East

The table below looks at the demand and provides a guide to the median salaries quoted in IT jobs citing Kubernetes within the South East region over the 6 months to 1 May 2025. The 'Rank Change' column provides an indication of the change in demand within each location based on the same 6 month period last year.

Location Rank Change
on Same Period
Last Year
Matching
Permanent
IT Job Ads
Median Salary
Past 6 Months
Median Salary
% Change
on Same Period
Last Year
Live
Jobs
Thames Valley -20 122 £72,500 -3.33% 62
Berkshire -19 90 £77,500 +3.33% 32
Hampshire +16 65 £65,000 -7.14% 29
Middlesex - 55 £62,500 - 3
Surrey +49 30 £60,000 -25.00% 27
Oxfordshire +39 17 £50,750 -30.00% 20
Buckinghamshire +36 15 £58,750 -9.62% 15
West Sussex +22 14 £60,000 -7.69% 8
Kent +13 8 £70,000 +27.27% 8
East Sussex +19 2 - - 5
Sussex +19 1 £66,500 -1.48% 10
Kubernetes
England

Kubernetes
Co-occurring Skills and Capabilities in the South East by Category

The follow tables expand on the table above by listing co-occurrences grouped by category. The same employment type, locality and period is covered with up to 20 co-occurrences shown in each of the following categories:

Application Platforms
1 16 (5.33%) Apache Spark
2 15 (5.00%) Apache
3 12 (4.00%) JBoss
3 12 (4.00%) Red Hat Fuse
4 10 (3.33%) Confluence
5 9 (3.00%) Apache Airflow
6 8 (2.67%) OpenStack
7 6 (2.00%) Microsoft Exchange
8 5 (1.67%) Apache Solr
8 5 (1.67%) nginx
9 1 (0.33%) CMS
9 1 (0.33%) Headless CMS
9 1 (0.33%) IIS
9 1 (0.33%) SharePoint
9 1 (0.33%) Strapi
9 1 (0.33%) Tomcat
Cloud Services
1 150 (50.00%) AWS
2 117 (39.00%) Azure
3 64 (21.33%) Amazon EKS
4 52 (17.33%) GCP
4 52 (17.33%) Serverless
5 36 (12.00%) Amazon ECS
6 29 (9.67%) Amazon EC2
7 26 (8.67%) Azure DevOps
8 25 (8.33%) AWS CloudFormation
9 22 (7.33%) GitHub
10 20 (6.67%) OpenShift
11 17 (5.67%) Amazon S3
12 15 (5.00%) SaaS
13 12 (4.00%) PaaS
14 7 (2.33%) Amazon Kinesis
14 7 (2.33%) Azure Functions
15 6 (2.00%) Amazon ECR
15 6 (2.00%) GitHub Actions
15 6 (2.00%) Slack
15 6 (2.00%) Virtual Private Cloud
Communications & Networking
1 20 (6.67%) DNS
2 11 (3.67%) DHCP
2 11 (3.67%) Network Security
3 6 (2.00%) TCP/IP
3 6 (2.00%) VSAN
4 5 (1.67%) Firewall
4 5 (1.67%) HTTPS
4 5 (1.67%) IPsec
4 5 (1.67%) NAS
4 5 (1.67%) Remote Desktop
4 5 (1.67%) SAN
4 5 (1.67%) SMTP
5 2 (0.67%) Broadband
5 2 (0.67%) Internet
6 1 (0.33%) iSCSI
6 1 (0.33%) VLAN
Database & Business Intelligence
1 60 (20.00%) NoSQL
2 59 (19.67%) PostgreSQL
3 47 (15.67%) Relational Database
4 37 (12.33%) MongoDB
5 23 (7.67%) SQL Server
6 22 (7.33%) MySQL
7 18 (6.00%) Elasticsearch
7 18 (6.00%) RDBMS
8 17 (5.67%) Redis
9 13 (4.33%) Hadoop
10 9 (3.00%) Apache Hudi
10 9 (3.00%) Apache Iceberg
10 9 (3.00%) Data Warehouse
10 9 (3.00%) Delta Lake
11 7 (2.33%) Big Data
11 7 (2.33%) Couchbase
12 6 (2.00%) Amazon RDS
13 5 (1.67%) Azure SQL Database
14 3 (1.00%) Apache Cassandra
14 3 (1.00%) Weaviate
Development Applications
1 94 (31.33%) Jenkins
2 88 (29.33%) Git
3 38 (12.67%) JUnit
4 26 (8.67%) Selenium
5 24 (8.00%) Mockito
6 22 (7.33%) GitLab
7 20 (6.67%) Cypress.io
8 19 (6.33%) JMeter
9 14 (4.67%) JIRA
10 12 (4.00%) Octopus Deploy
11 9 (3.00%) Artifactory
11 9 (3.00%) Bitbucket
11 9 (3.00%) Cucumber
12 8 (2.67%) git-flow
12 8 (2.67%) SoapUI
12 8 (2.67%) SonarQube
13 7 (2.33%) Gradle
14 5 (1.67%) Vite
14 5 (1.67%) webpack
15 4 (1.33%) Gatling
General
1 51 (17.00%) Law
1 51 (17.00%) Social Skills
2 44 (14.67%) Finance
3 36 (12.00%) Analytical Skills
4 34 (11.33%) Public Sector
5 33 (11.00%) Inclusion and Diversity
6 18 (6.00%) Banking
7 12 (4.00%) Games
7 12 (4.00%) Telecoms
8 8 (2.67%) Legal
9 7 (2.33%) Manufacturing
10 6 (2.00%) Electronics
11 5 (1.67%) Presentation Skills
12 4 (1.33%) Military
13 3 (1.00%) Organisational Skills
13 3 (1.00%) Retail
14 1 (0.33%) Influencing Skills
14 1 (0.33%) Investment Banking
14 1 (0.33%) Pharmaceutical
Job Titles
1 117 (39.00%) Developer
2 71 (23.67%) Senior
3 51 (17.00%) Java Developer
4 42 (14.00%) Software Engineer
5 39 (13.00%) DevOps Engineer
6 33 (11.00%) Software Developer
7 28 (9.33%) Lead
8 25 (8.33%) Senior Developer
9 22 (7.33%) Principal Engineer
10 15 (5.00%) Gen AI Engineer
11 14 (4.67%) Full-Stack Developer
11 14 (4.67%) Python Engineer
11 14 (4.67%) Senior Software Engineer
12 12 (4.00%) .NET Developer
12 12 (4.00%) Artificial Intelligence Engineer
12 12 (4.00%) C# .NET Developer
12 12 (4.00%) C# Developer
12 12 (4.00%) Principal Software Engineer
12 12 (4.00%) Support Engineer
13 11 (3.67%) Azure Engineer
Libraries, Frameworks & Software Standards
1 71 (23.67%) React
2 65 (21.67%) REST
3 62 (20.67%) .NET
4 58 (19.33%) Node.js
5 57 (19.00%) Spring Boot
6 45 (15.00%) Spring
7 44 (14.67%) Kafka
8 36 (12.00%) Web Services
9 32 (10.67%) RabbitMQ
10 30 (10.00%) Apache Camel
11 28 (9.33%) HTML
12 23 (7.67%) Jest
13 21 (7.00%) Hibernate
13 21 (7.00%) RESTful
14 20 (6.67%) Pandas
15 18 (6.00%) ActiveMQ
15 18 (6.00%) jQuery
15 18 (6.00%) WireMock
16 13 (4.33%) Next.js
17 12 (4.00%) Vue
Miscellaneous
1 45 (15.00%) Distributed Systems
2 23 (7.67%) Cloud Native
3 22 (7.33%) Public Cloud
4 18 (6.00%) Algorithms
4 18 (6.00%) Cyberattack
5 16 (5.33%) Management Information System
6 15 (5.00%) Greenfield Project
7 10 (3.33%) Clustering
8 7 (2.33%) Product Ownership
9 6 (2.00%) Molecular Biology
10 5 (1.67%) Legacy Systems
10 5 (1.67%) PKI
10 5 (1.67%) Virtual Team
11 4 (1.33%) Data Structures
11 4 (1.33%) IoT
12 3 (1.00%) Embedded Systems
12 3 (1.00%) Hybrid Cloud
13 2 (0.67%) BBC
13 2 (0.67%) Hackathon
13 2 (0.67%) Learning Management System
Operating Systems
1 63 (21.00%) Linux
2 30 (10.00%) Windows
3 22 (7.33%) Android
4 13 (4.33%) Windows Server
5 12 (4.00%) Unix
6 5 (1.67%) SUSE
6 5 (1.67%) SUSE Linux Enterprise Server
7 4 (1.33%) Apple iOS
8 3 (1.00%) Ubuntu
9 2 (0.67%) CentOS
9 2 (0.67%) Windows Server 2016
10 1 (0.33%) Mac OS
10 1 (0.33%) VMS
10 1 (0.33%) Windows Server 2003
Processes & Methodologies
1 156 (52.00%) CI/CD
2 153 (51.00%) Agile
3 98 (32.67%) DevOps
4 85 (28.33%) Microservices
5 82 (27.33%) Software Engineering
6 67 (22.33%) TDD
7 64 (21.33%) Computer Science
8 61 (20.33%) Containerisation
9 58 (19.33%) Artificial Intelligence
9 58 (19.33%) Problem-Solving
10 51 (17.00%) Kanban
11 50 (16.67%) Collaborative Working
12 43 (14.33%) BDD
12 43 (14.33%) Scrum
13 41 (13.67%) Design Patterns
14 36 (12.00%) High Availability
14 36 (12.00%) Machine Learning
15 35 (11.67%) Full-Stack Development
16 34 (11.33%) SDLC
17 32 (10.67%) Infrastructure as Code
Programming Languages
1 137 (45.67%) Python
2 109 (36.33%) Java
3 99 (33.00%) JavaScript
4 57 (19.00%) TypeScript
5 53 (17.67%) Go
6 44 (14.67%) C#
7 39 (13.00%) SQL
8 34 (11.33%) Rust
9 32 (10.67%) C++
10 24 (8.00%) PowerShell
11 21 (7.00%) Shell Script
12 15 (5.00%) PHP
13 13 (4.33%) Ruby
14 11 (3.67%) C
15 10 (3.33%) Bash
15 10 (3.33%) Perl
16 7 (2.33%) Scala
17 6 (2.00%) Clojure
17 6 (2.00%) Elixir
18 4 (1.33%) Kotlin
Qualifications
1 66 (22.00%) Security Cleared
2 62 (20.67%) Degree
3 36 (12.00%) SC Cleared
4 32 (10.67%) DV Cleared
5 23 (7.67%) Computer Science Degree
6 9 (3.00%) AWS Certification
7 8 (2.67%) OCP
7 8 (2.67%) Oracle Certification
8 6 (2.00%) VMware Certified Professional (VCP)
9 5 (1.67%) Master's Degree
10 2 (0.67%) Azure Certification
11 1 (0.33%) AWS Certified Solutions Architect
11 1 (0.33%) Microsoft Certification
11 1 (0.33%) PhD
11 1 (0.33%) VCAP
Quality Assurance & Compliance
1 38 (12.67%) Accessibility
2 12 (4.00%) SLA
3 11 (3.67%) Data Quality
4 6 (2.00%) QA
4 6 (2.00%) WCAG
5 1 (0.33%) GMP
System Software
1 183 (61.00%) Docker
2 24 (8.00%) VMware Infrastructure
3 17 (5.67%) vSphere
4 14 (4.67%) Hyper-V
5 13 (4.33%) HDFS
6 12 (4.00%) Active Directory
7 11 (3.67%) VMware ESXi
8 6 (2.00%) NFS
9 5 (1.67%) BitLocker
9 5 (1.67%) Microsoft App-V
9 5 (1.67%) Terminal Services
10 3 (1.00%) Virtual Machines
11 1 (0.33%) vCloud
11 1 (0.33%) VMware NSX
Systems Management
1 90 (30.00%) Terraform
2 87 (29.00%) Ansible
3 20 (6.67%) Puppet
4 18 (6.00%) Kibana
5 13 (4.33%) vCenter Server
6 10 (3.33%) vMotion
7 7 (2.33%) Prometheus
8 6 (2.00%) Kustomize
8 6 (2.00%) PowerCLI
8 6 (2.00%) Progress Chef
8 6 (2.00%) vRealize
9 5 (1.67%) Nagios
10 4 (1.33%) Grafana
11 3 (1.00%) Kubeflow
12 2 (0.67%) Argo
12 2 (0.67%) Hadoop YARN
12 2 (0.67%) Kubespray
12 2 (0.67%) Packer
13 1 (0.33%) Nessus
13 1 (0.33%) ZABBIX
Vendors
1 26 (8.67%) Microsoft
2 25 (8.33%) VMware
3 18 (6.00%) Dynatrace
3 18 (6.00%) Splunk
4 13 (4.33%) Google
5 11 (3.67%) Citrix
5 11 (3.67%) Red Hat
6 10 (3.33%) HP
7 9 (3.00%) Rackspace
8 6 (2.00%) Sawtooth Software
8 6 (2.00%) Veeam
9 5 (1.67%) SAP
9 5 (1.67%) Symantec
10 4 (1.33%) Atlassian
11 2 (0.67%) AppDynamics
11 2 (0.67%) Cloudera
11 2 (0.67%) Confluent
11 2 (0.67%) Dataiku
11 2 (0.67%) IBM
11 2 (0.67%) MapR