Docker Jobs in the South East

Docker
England > South East

The table below provides summary statistics for permanent job vacancies advertised in the South East requiring Docker skills. It includes a benchmarking guide to the annual salaries offered in vacancies that cited Docker over the 6 months leading up to 21 June 2025, comparing them to the same period in the previous two years.

6 months to
21 Jun 2025
Same period 2024 Same period 2023
Rank 107 66 50
Rank change year-on-year -41 -16 -17
Permanent jobs citing Docker 264 654 704
As % of all permanent jobs advertised in the South East 2.74% 3.44% 5.38%
As % of the System Software category 28.12% 26.73% 32.18%
Number of salaries quoted 148 496 481
10th Percentile £48,000 £42,500 £46,250
25th Percentile £56,250 £52,500 £53,750
Median annual salary (50th Percentile) £70,000 £65,000 £67,500
Median % change year-on-year +7.69% -3.70% -3.57%
75th Percentile £83,750 £82,500 £81,250
90th Percentile £84,125 £95,000 £96,250
England median annual salary £75,000 £70,000 £72,500
% change year-on-year +7.14% -3.45% -

All System Software Skills
South East

Docker falls under the System Software category. For comparison with the information above, the following table provides summary statistics for all permanent job vacancies requiring system software skills in the South East.

Permanent vacancies with a requirement for system software skills 939 2,447 2,188
As % of all permanent jobs advertised in the South East 9.75% 12.87% 16.72%
Number of salaries quoted 604 1,891 1,544
10th Percentile £28,250 £26,250 £25,750
25th Percentile £36,250 £32,500 £31,325
Median annual salary (50th Percentile) £50,000 £47,500 £49,875
Median % change year-on-year +5.26% -4.76% -0.25%
75th Percentile £73,750 £62,500 £67,500
90th Percentile £86,250 £78,750 £81,250
England median annual salary £52,500 £49,881 £55,000
% change year-on-year +5.25% -9.31% -

Docker
Job Vacancy Trend in the South East

Job postings citing Docker as a proportion of all IT jobs advertised in the South East.
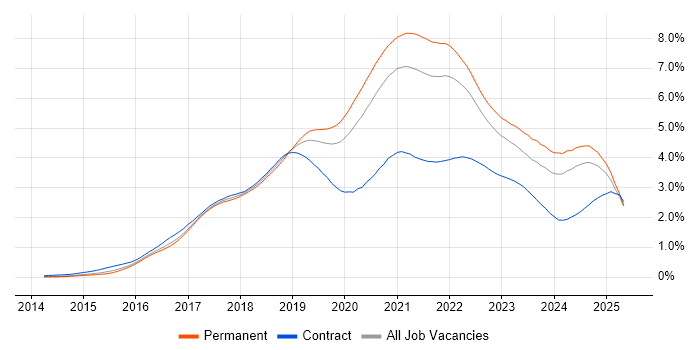
Job vacancy trend for Docker in the South East

Docker
Salary Trend in the South East

3-month moving average salary quoted in jobs citing Docker in the South East.

Salary trend for Docker in the South East

Docker
Salary Histogram in the South East

Salary distribution for jobs citing Docker in the South East over the 6 months to 21 June 2025.

Salary histogram for Docker in the South East

Docker
Job Locations in the South East

The table below looks at the demand and provides a guide to the median salaries quoted in IT jobs citing Docker within the South East region over the 6 months to 21 June 2025. The 'Rank Change' column provides an indication of the change in demand within each location based on the same 6 month period last year.

Location Rank Change
on Same Period
Last Year
Matching
Permanent
IT Job Ads
Median Salary
Past 6 Months
Median Salary
% Change
on Same Period
Last Year
Live
Jobs
Thames Valley -16 137 £75,000 +3.45% 408
Berkshire -14 92 £82,500 +10.00% 285
Surrey +31 47 £71,250 +14.00% 82
Hampshire -35 35 £57,500 -14.81% 121
Buckinghamshire +25 29 £70,000 +21.74% 67
Oxfordshire +45 16 £57,500 -19.30% 57
Kent +27 14 £70,000 +27.27% 38
Middlesex -7 11 £62,500 +8.70%
East Sussex -1 8 £50,000 -13.04% 63
West Sussex +2 7 £70,000 +9.38% 58
Docker
England

Docker
Co-occurring Skills and Capabilities in the South East by Category

The follow tables expand on the table above by listing co-occurrences grouped by category. The same employment type, locality and period is covered with up to 20 co-occurrences shown in each of the following categories:

Application Platforms
1 20 (7.58%) Confluence
2 13 (4.92%) JBoss
2 13 (4.92%) Red Hat Fuse
3 11 (4.17%) Microsoft Exchange
4 4 (1.52%) Apache
4 4 (1.52%) OpenStack
5 2 (0.76%) Apache Spark
5 2 (0.76%) IIS
5 2 (0.76%) nginx
Applications
1 4 (1.52%) Mozilla Thunderbird
2 2 (0.76%) Simulink
Business Applications
1 1 (0.38%) Payment Gateway
Cloud Services
1 168 (63.64%) AWS
2 120 (45.45%) Azure
3 53 (20.08%) Serverless
4 52 (19.70%) Amazon EKS
5 44 (16.67%) Azure DevOps
6 39 (14.77%) Amazon ECS
7 35 (13.26%) GCP
8 32 (12.12%) Azure Cosmos DB
9 31 (11.74%) Azure Service Bus
10 28 (10.61%) SonarCloud
11 27 (10.23%) Amazon EC2
12 25 (9.47%) Pulumi
13 19 (7.20%) AWS CloudFormation
14 18 (6.82%) Amazon S3
14 18 (6.82%) GitHub
15 11 (4.17%) AWS KMS
16 10 (3.79%) Amazon SQS
17 9 (3.41%) SaaS
18 8 (3.03%) AWS Lambda
19 7 (2.65%) Amazon CloudWatch
Communications & Networking
1 27 (10.23%) Broadband
2 20 (7.58%) Firewall
3 15 (5.68%) DNS
4 12 (4.55%) DHCP
5 11 (4.17%) Remote Desktop
5 11 (4.17%) SAN
6 9 (3.41%) Network Security
7 8 (3.03%) SMTP
8 6 (2.27%) NAS
8 6 (2.27%) VSAN
9 5 (1.89%) iSCSI
10 4 (1.52%) SSL
11 2 (0.76%) FTP
11 2 (0.76%) HTTP
11 2 (0.76%) Internet
11 2 (0.76%) MQTT
11 2 (0.76%) SSH
11 2 (0.76%) WAN
Database & Business Intelligence
1 68 (25.76%) PostgreSQL
2 66 (25.00%) Relational Database
3 50 (18.94%) NoSQL
4 48 (18.18%) Elasticsearch
5 44 (16.67%) RDBMS
6 33 (12.50%) SQL Server
7 25 (9.47%) MongoDB
8 17 (6.44%) MySQL
9 15 (5.68%) Amazon RDS
10 13 (4.92%) Redis
11 7 (2.65%) Amazon Aurora
12 6 (2.27%) DynamoDB
13 4 (1.52%) Couchbase
14 3 (1.14%) Apache Cassandra
14 3 (1.14%) Azure SQL Database
14 3 (1.14%) Pinecone
14 3 (1.14%) Weaviate
15 2 (0.76%) Data Warehouse
15 2 (0.76%) Oracle Database
15 2 (0.76%) Power BI
Development Applications
1 87 (32.95%) Git
2 75 (28.41%) Jenkins
3 43 (16.29%) JUnit
4 40 (15.15%) Octopus Deploy
5 30 (11.36%) Visual Studio
6 29 (10.98%) MSBuild
7 28 (10.61%) Team Foundation Server
8 26 (9.85%) Mockito
9 25 (9.47%) Jaeger
9 25 (9.47%) JIRA
10 19 (7.20%) SonarQube
11 18 (6.82%) JMeter
11 18 (6.82%) Selenium
12 17 (6.44%) Maven
13 16 (6.06%) GitLab
14 10 (3.79%) Sonatype Nexus
15 9 (3.41%) Bitbucket Server
16 8 (3.03%) Bitbucket
16 8 (3.03%) Cucumber
17 5 (1.89%) jMock
General
1 72 (27.27%) Inclusion and Diversity
2 41 (15.53%) Public Sector
3 35 (13.26%) Social Skills
4 29 (10.98%) Analytical Skills
5 24 (9.09%) Finance
5 24 (9.09%) Retail
6 8 (3.03%) Banking
7 6 (2.27%) Organisational Skills
7 6 (2.27%) Presentation Skills
8 5 (1.89%) Advertising
9 4 (1.52%) Pharmaceutical
9 4 (1.52%) Telecoms
10 2 (0.76%) Publishing
11 1 (0.38%) Front Office
11 1 (0.38%) Influencing Skills
11 1 (0.38%) Manufacturing
11 1 (0.38%) Military
Job Titles
1 106 (40.15%) Developer
2 54 (20.45%) Java Developer
3 42 (15.91%) Lead
4 36 (13.64%) Architect
5 30 (11.36%) Senior
6 29 (10.98%) Technical Architect
7 27 (10.23%) Team Leader
8 22 (8.33%) Software Developer
9 21 (7.95%) Software Engineer
10 20 (7.58%) DevOps Engineer
11 18 (6.82%) Full-Stack Developer
12 16 (6.06%) Senior Developer
13 13 (4.92%) Support Engineer
14 10 (3.79%) C# Developer
14 10 (3.79%) Full-Stack Java Developer
14 10 (3.79%) Lead Developer
15 9 (3.41%) .NET Developer
15 9 (3.41%) C# .NET Developer
15 9 (3.41%) Infrastructure Engineer
16 8 (3.03%) Administrator
Libraries, Frameworks & Software Standards
1 93 (35.23%) REST
2 72 (27.27%) .NET
3 69 (26.14%) Spring Boot
4 59 (22.35%) Spring
5 58 (21.97%) HTML
6 54 (20.45%) React
7 41 (15.53%) CSS
7 41 (15.53%) Web Services
8 40 (15.15%) JSON
9 39 (14.77%) Node.js
9 39 (14.77%) XML
10 35 (13.26%) Bootstrap
10 35 (13.26%) Hibernate
11 31 (11.74%) gRPC
12 30 (11.36%) Apache Camel
12 30 (11.36%) ASP.NET
12 30 (11.36%) Elastic Stack
12 30 (11.36%) Kafka
13 29 (10.98%) RESTful
14 28 (10.61%) ActiveMQ
Miscellaneous
1 42 (15.91%) Distributed Systems
2 18 (6.82%) Cloud Native
2 18 (6.82%) Cyberattack
3 13 (4.92%) Product Ownership
4 12 (4.55%) Clustering
5 10 (3.79%) Legacy Systems
6 8 (3.03%) Enterprise Software
7 6 (2.27%) Algorithms
7 6 (2.27%) Distributed Architecture
7 6 (2.27%) Management Information System
7 6 (2.27%) PKI
8 5 (1.89%) IoT
8 5 (1.89%) Self-Motivation
9 4 (1.52%) Greenfield Project
10 3 (1.14%) Mobile App
10 3 (1.14%) Public Cloud
11 2 (0.76%) Data Structures
11 2 (0.76%) Onboarding
11 2 (0.76%) Replication
12 1 (0.38%) Operational Technology
Operating Systems
1 90 (34.09%) Linux
2 28 (10.61%) Windows
3 27 (10.23%) Unix
4 18 (6.82%) Android
5 15 (5.68%) Windows Server
6 5 (1.89%) Red Hat Enterprise Linux
6 5 (1.89%) SUSE
6 5 (1.89%) SUSE Linux Enterprise Server
6 5 (1.89%) Ubuntu
6 5 (1.89%) Windows Server 2019
7 2 (0.76%) Amazon Linux
7 2 (0.76%) VMS
8 1 (0.38%) Windows Server 2003
Processes & Methodologies
1 146 (55.30%) Agile
2 133 (50.38%) DevOps
3 121 (45.83%) Microservices
4 110 (41.67%) CI/CD
5 90 (34.09%) Containerisation
6 74 (28.03%) TDD
7 66 (25.00%) Performance Optimisation
8 61 (23.11%) Design Patterns
9 57 (21.59%) Software Engineering
10 56 (21.21%) Problem-Solving
11 52 (19.70%) Kanban
12 48 (18.18%) Full-Stack Development
12 48 (18.18%) High Availability
13 47 (17.80%) Infrastructure as Code
14 43 (16.29%) Mentoring
15 42 (15.91%) Scrum
16 41 (15.53%) BDD
17 40 (15.15%) Task Automation
18 38 (14.39%) MVC
19 34 (12.88%) Continuous Integration
Programming Languages
1 135 (51.14%) JavaScript
2 132 (50.00%) Java
3 107 (40.53%) Python
4 57 (21.59%) SQL
5 52 (19.70%) C#
6 48 (18.18%) Go
7 41 (15.53%) Bash
8 25 (9.47%) TypeScript
9 24 (9.09%) PowerShell
10 23 (8.71%) C++
11 22 (8.33%) Shell Script
12 18 (6.82%) Rust
13 13 (4.92%) PHP
14 5 (1.89%) Korn
15 4 (1.52%) Groovy
15 4 (1.52%) Perl
16 3 (1.14%) R
17 2 (0.76%) C
17 2 (0.76%) MATLAB
17 2 (0.76%) Scala
Qualifications
1 77 (29.17%) Security Cleared
2 40 (15.15%) SC Cleared
3 36 (13.64%) DV Cleared
4 29 (10.98%) AWS Certification
5 25 (9.47%) Degree
6 10 (3.79%) Computer Science Degree
7 6 (2.27%) VMware Certified Professional (VCP)
8 5 (1.89%) Azure Certification
9 3 (1.14%) Numerate Degree
10 2 (0.76%) AWS Certified Solutions Architect
10 2 (0.76%) Master's Degree
11 1 (0.38%) Microsoft Certification
11 1 (0.38%) PhD
11 1 (0.38%) Postgraduate
Quality Assurance & Compliance
1 30 (11.36%) GDPR
2 13 (4.92%) SLA
3 12 (4.55%) QA
4 2 (0.76%) Accessibility
4 2 (0.76%) HIPAA
5 1 (0.38%) CDISC
5 1 (0.38%) Data Quality
5 1 (0.38%) GMP
5 1 (0.38%) ISO/IEC 27001
5 1 (0.38%) SOC 2
System Software
1 26 (9.85%) Active Directory
2 21 (7.95%) VMware Infrastructure
3 15 (5.68%) VMware ESXi
4 12 (4.55%) Hyper-V
4 12 (4.55%) vSphere
5 8 (3.03%) Virtual Machines
6 6 (2.27%) BitLocker
6 6 (2.27%) Microsoft App-V
6 6 (2.27%) Terminal Services
7 5 (1.89%) Citrix Hypervisor
7 5 (1.89%) NFS
8 4 (1.52%) Virtual Desktop
9 2 (0.76%) DFS Replication
9 2 (0.76%) HDFS
9 2 (0.76%) vCloud
10 1 (0.38%) Postfix
Systems Management
1 183 (69.32%) Kubernetes
2 85 (32.20%) Ansible
3 77 (29.17%) Terraform
4 36 (13.64%) Prometheus
5 26 (9.85%) Argo
6 25 (9.47%) Kustomize
7 17 (6.44%) Kibana
8 12 (4.55%) Puppet
8 12 (4.55%) vCenter Server
8 12 (4.55%) vMotion
9 11 (4.17%) Grafana
10 6 (2.27%) Nagios
10 6 (2.27%) PowerCLI
10 6 (2.27%) vRealize
11 4 (1.52%) Nessus
11 4 (1.52%) Proxmox
12 3 (1.14%) Kubeflow
13 2 (0.76%) Docker Swarm
13 2 (0.76%) Rundeck
14 1 (0.38%) FortiGate
Vendors
1 35 (13.26%) Google
2 30 (11.36%) Microsoft
3 23 (8.71%) VMware
4 22 (8.33%) Splunk
5 17 (6.44%) Dynatrace
6 12 (4.55%) Citrix
6 12 (4.55%) HP
7 8 (3.03%) Solace
8 7 (2.65%) Veeam
9 6 (2.27%) Oracle
9 6 (2.27%) Symantec
10 5 (1.89%) Atlassian
10 5 (1.89%) Dell
10 5 (1.89%) Red Hat
10 5 (1.89%) SAP
11 4 (1.52%) CA Agile Central
11 4 (1.52%) Juniper
12 3 (1.14%) Jaspersoft
13 2 (0.76%) ServiceNow
13 2 (0.76%) WSO2