Microsoft Excel Jobs in the South East

Microsoft Excel
England > South East

The table below provides summary statistics for permanent job vacancies advertised in the South East requiring Microsoft Excel skills. It includes a benchmarking guide to the annual salaries offered in vacancies that cited Microsoft Excel over the 6 months leading up to 26 July 2024, comparing them to the same period in the previous two years.

6 months to
26 Jul 2024
Same period 2023 Same period 2022
Rank 21 79 69
Rank change year-on-year +58 -10 +66
Permanent jobs citing Microsoft Excel 1,100 427 995
As % of all permanent jobs advertised in the South East 7.29% 3.68% 4.51%
As % of the Applications category 56.99% 40.47% 41.68%
Number of salaries quoted 343 255 427
10th Percentile £26,250 £25,750 £26,500
25th Percentile £31,000 £30,500 £32,500
Median annual salary (50th Percentile) £44,309 £40,000 £47,500
Median % change year-on-year +10.77% -15.79% +11.76%
75th Percentile £49,000 £50,125 £60,000
90th Percentile £60,000 £61,250 £65,000
England median annual salary £42,500 £42,500 £46,500
% change year-on-year - -8.60% +9.41%

All Software Application Skills
South East

Microsoft Excel falls under the Software Applications category. For comparison with the information above, the following table provides summary statistics for all permanent job vacancies requiring software application skills in the South East.

Permanent vacancies with a requirement for software application skills 1,930 1,055 2,387
As % of all permanent jobs advertised in the South East 12.79% 9.10% 10.82%
Number of salaries quoted 948 670 1,158
10th Percentile £25,000 £25,000 £26,000
25th Percentile £29,000 £29,750 £30,000
Median annual salary (50th Percentile) £42,500 £41,500 £42,500
Median % change year-on-year +2.41% -2.35% +2.41%
75th Percentile £55,000 £57,500 £57,500
90th Percentile £71,250 £70,000 £65,000
England median annual salary £40,450 £45,000 £45,000
% change year-on-year -10.11% - -

Microsoft Excel
Job Vacancy Trend in the South East

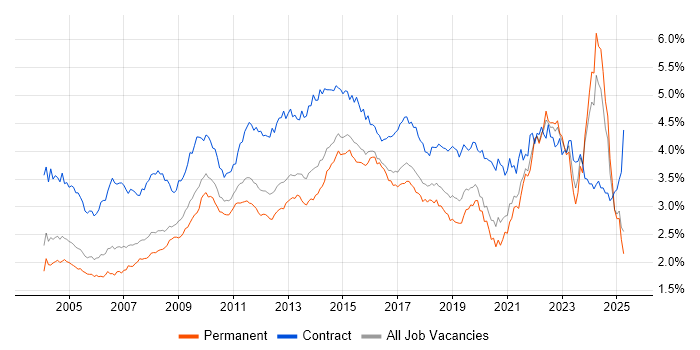
Job postings citing Microsoft Excel as a proportion of all IT jobs advertised in the South East.

Job vacancy trend for Microsoft Excel in the South East

Microsoft Excel
Salary Trend in the South East

3-month moving average salary quoted in jobs citing Microsoft Excel in the South East.

Salary trend for Microsoft Excel in the South East

Microsoft Excel
Salary Histogram in the South East

Salary distribution for jobs citing Microsoft Excel in the South East over the 6 months to 26 July 2024.

Salary histogram for Microsoft Excel in the South East

Microsoft Excel
Job Locations in the South East

The table below looks at the demand and provides a guide to the median salaries quoted in IT jobs citing Microsoft Excel within the South East region over the 6 months to 26 July 2024. The 'Rank Change' column provides an indication of the change in demand within each location based on the same 6 month period last year.

Location Rank Change
on Same Period
Last Year
Matching
Permanent
IT Job Ads
Median Salary
Past 6 Months
Median Salary
% Change
on Same Period
Last Year
Live
Jobs
Thames Valley +54 524 £45,000 +15.38% 57
Surrey +52 328 £42,500 -26.09% 20
Buckinghamshire +53 192 £45,000 +31.39% 22
Berkshire +33 180 £42,500 +1.19% 23
Oxfordshire +44 152 £42,000 +35.48% 12
Hampshire +23 116 £35,000 -6.67% 37
Kent +10 61 £45,000 +69.81% 23
Middlesex +10 40 £48,500 -
East Sussex +23 15 £25,760 -20.74% 5
West Sussex -14 13 £27,000 -46.00% 18
Sussex - 2 £32,750 - 2
Microsoft Excel
England

Microsoft Excel
Co-occurring Skills and Capabilities in the South East by Category

The follow tables expand on the table above by listing co-occurrences grouped by category. The same employment type, locality and period is covered with up to 20 co-occurrences shown in each of the following categories:

Application Platforms
1 16 (1.45%) SharePoint
2 15 (1.36%) Microsoft Exchange
3 7 (0.64%) SAS
4 6 (0.55%) Apache
4 6 (0.55%) CMS
4 6 (0.55%) Oracle Workflow
4 6 (0.55%) Tomcat
5 3 (0.27%) Oracle Service Bus
5 3 (0.27%) WebLogic
6 2 (0.18%) IIS
7 1 (0.091%) Confluence
7 1 (0.091%) TPMS
7 1 (0.091%) WordPress
Applications
1 363 (33.00%) Microsoft Office
2 172 (15.64%) Microsoft PowerPoint
3 75 (6.82%) Microsoft Project
4 45 (4.09%) MS Visio
5 25 (2.27%) Spreadsheet
6 13 (1.18%) AutoCAD
7 4 (0.36%) Photoshop
8 3 (0.27%) SPSS
9 2 (0.18%) Fireworks
10 1 (0.091%) Adobe Creative Suite
10 1 (0.091%) Adobe Illustrator
10 1 (0.091%) InDesign
10 1 (0.091%) SOLIDWORKS
Business Applications
1 53 (4.82%) Primavera
2 7 (0.64%) SAP Business One
3 6 (0.55%) Oracle Applications
4 5 (0.45%) ResourceLink
5 4 (0.36%) Oracle ERP
5 4 (0.36%) Unit4 Business World
6 3 (0.27%) Remedy ITSM
6 3 (0.27%) SAP MDM
6 3 (0.27%) SAP S/4HANA
7 2 (0.18%) Maximo
7 2 (0.18%) NetSuite
7 2 (0.18%) Oracle EBS
7 2 (0.18%) Oracle Financials
7 2 (0.18%) Oracle Receivables
7 2 (0.18%) SAP WM
8 1 (0.091%) SAP GTM
8 1 (0.091%) SAP MDG
8 1 (0.091%) SAP Oil and Gas
Cloud Services
1 135 (12.27%) Power Platform
2 62 (5.64%) Microsoft 365
3 44 (4.00%) Azure
4 19 (1.73%) Entra ID
5 18 (1.64%) OneDrive
6 17 (1.55%) PowerApps
7 14 (1.27%) Power Automate
8 12 (1.09%) SaaS
9 11 (1.00%) ShareGate
10 7 (0.64%) AWS
10 7 (0.64%) Google Analytics
11 6 (0.55%) Veeva
12 5 (0.45%) Azure DevOps
12 5 (0.45%) Google Ads
12 5 (0.45%) SuccessFactors
13 4 (0.36%) GitHub
13 4 (0.36%) PaaS
14 3 (0.27%) Google Workspace
14 3 (0.27%) Slack
14 3 (0.27%) Snowflake
Communications & Networking
1 195 (17.73%) Broadband
2 20 (1.82%) Firewall
3 6 (0.55%) Remote Desktop
4 5 (0.45%) Intranet
5 4 (0.36%) Ethernet
5 4 (0.36%) Structured Cabling
5 4 (0.36%) TCP/IP
6 3 (0.27%) DNS
6 3 (0.27%) Fibre Channel
6 3 (0.27%) iSCSI
6 3 (0.27%) NAS
6 3 (0.27%) Radio Access Network
6 3 (0.27%) SAN
7 2 (0.18%) Multicast
7 2 (0.18%) Wi-Fi
8 1 (0.091%) 4G
8 1 (0.091%) Internet
8 1 (0.091%) RS-232
8 1 (0.091%) RSVP
8 1 (0.091%) VPN
Database & Business Intelligence
1 131 (11.91%) Power BI
2 43 (3.91%) Tableau
3 22 (2.00%) SQL Server
4 11 (1.00%) MS Access
5 9 (0.82%) Data Warehouse
6 7 (0.64%) Relational Database
7 6 (0.55%) Oracle Reports
8 5 (0.45%) SQL Server Reporting Services
9 4 (0.36%) Big Data
9 4 (0.36%) Crystal Reports
9 4 (0.36%) Oracle Database
9 4 (0.36%) Power Query
9 4 (0.36%) PowerPivot
9 4 (0.36%) RDBMS
10 3 (0.27%) Data Lake
10 3 (0.27%) Oracle Database 10g
10 3 (0.27%) Oracle Database 11g
10 3 (0.27%) VLDB
11 2 (0.18%) QlikView
11 2 (0.18%) SQL Server Integration Services
Development Applications
1 15 (1.36%) JIRA
2 6 (0.55%) Oracle Forms
3 4 (0.36%) Git
3 4 (0.36%) GitLab
3 4 (0.36%) Visual Studio
4 2 (0.18%) Balsamiq
5 1 (0.091%) Gradle
5 1 (0.091%) SQL Server Management Studio (SSMS)
5 1 (0.091%) Visual Studio Code
General
1 615 (55.91%) Social Skills
2 527 (47.91%) Analytical Skills
3 466 (42.36%) Finance
4 230 (20.91%) Retail
5 200 (18.18%) Influencing Skills
6 191 (17.36%) Marketing
7 115 (10.45%) Organisational Skills
8 66 (6.00%) German Language
9 58 (5.27%) Pharmaceutical
10 45 (4.09%) Presentation Skills
11 40 (3.64%) Legal
12 36 (3.27%) Inclusion and Diversity
13 31 (2.82%) Telecoms
14 21 (1.91%) Military
15 19 (1.73%) Manufacturing
16 13 (1.18%) Law
17 12 (1.09%) Billing
18 6 (0.55%) Advertising
18 6 (0.55%) Korean Language
19 5 (0.45%) Local Government
Job Titles
1 352 (32.00%) Analyst
2 165 (15.00%) Senior
3 129 (11.73%) Senior Analyst
4 116 (10.55%) Development Manager
5 102 (9.27%) Coordinator
6 81 (7.36%) Graduate
7 63 (5.73%) Financial Analyst
8 52 (4.73%) Lead
8 52 (4.73%) Project Controller
9 51 (4.64%) Commercial Analyst
10 35 (3.18%) Data Analyst
11 34 (3.09%) Support Engineer
12 30 (2.73%) IT Support
13 29 (2.64%) Project Manager
14 28 (2.55%) IT Engineer
15 25 (2.27%) IT Support Engineer
16 17 (1.55%) Administrator
17 16 (1.45%) Developer
18 15 (1.36%) Project Leader
18 15 (1.36%) Senior Project Leader
Libraries, Frameworks & Software Standards
1 11 (1.00%) EDI
2 9 (0.82%) JSON
3 8 (0.73%) .NET
4 6 (0.55%) JSP
4 6 (0.55%) Web Services
4 6 (0.55%) XML
5 5 (0.45%) CSS
5 5 (0.45%) HTML
6 2 (0.18%) .NET Framework
6 2 (0.18%) GraphQL
6 2 (0.18%) RESTful
7 1 (0.091%) .NET Core
7 1 (0.091%) AngularJS
7 1 (0.091%) Apache Cordova
7 1 (0.091%) Entity Framework
7 1 (0.091%) Ionic Framework
7 1 (0.091%) jQuery
7 1 (0.091%) Leaflet
7 1 (0.091%) Middleware
7 1 (0.091%) React
Miscellaneous
1 243 (22.09%) Self-Motivation
2 93 (8.45%) Management Information System
3 86 (7.82%) Driving Licence
4 36 (3.27%) NHS
5 31 (2.82%) Onboarding
6 15 (1.36%) Life Science
7 12 (1.09%) Product Ownership
7 12 (1.09%) Replication
8 7 (0.64%) Algorithms
8 7 (0.64%) Analytical Mindset
8 7 (0.64%) Biopharmaceutical
8 7 (0.64%) Data Centre
9 6 (0.55%) PMI
9 6 (0.55%) Pricing Data
10 5 (0.45%) Cyber Security Posture
10 5 (0.45%) FMCG
10 5 (0.45%) Housing Association
11 4 (0.36%) Enterprise Software
11 4 (0.36%) SCADA
12 3 (0.27%) Credit Risk
Operating Systems
1 74 (6.73%) Windows
2 19 (1.73%) Linux
3 18 (1.64%) Windows Server
4 4 (0.36%) Unix
5 3 (0.27%) Android
5 3 (0.27%) Solaris
5 3 (0.27%) VxWorks
6 2 (0.18%) Mac OS
7 1 (0.091%) Windows 10
Processes & Methodologies
1 370 (33.64%) Agile
2 293 (26.64%) Decision-Making
3 269 (24.45%) Actionable Insight
4 247 (22.45%) Mentoring
5 231 (21.00%) Business Case
6 228 (20.73%) Problem-Solving
7 209 (19.00%) Budgeting and Forecasting
7 209 (19.00%) Business Development
8 203 (18.45%) Budgeting
9 192 (17.45%) Customer Requirements
10 172 (15.64%) Logistics
11 167 (15.18%) Data Management
12 138 (12.55%) Commercial Awareness
13 135 (12.27%) CAD
13 135 (12.27%) Facilities Management
14 134 (12.18%) Financial Modelling
15 133 (12.09%) Project Management
16 114 (10.36%) Business Intelligence
17 88 (8.00%) Continuous Improvement
18 83 (7.55%) Data Analysis
Programming Languages
1 82 (7.45%) SQL
2 23 (2.09%) VBA
3 20 (1.82%) R
4 17 (1.55%) Python
5 15 (1.36%) JavaScript
6 12 (1.09%) C#
7 8 (0.73%) Bash
8 6 (0.55%) Java
8 6 (0.55%) PHP
9 5 (0.45%) C++
10 4 (0.36%) Data Analysis Expressions
11 3 (0.27%) PL/SQL
11 3 (0.27%) PowerShell
11 3 (0.27%) VB.NET
12 2 (0.18%) T-SQL
12 2 (0.18%) VB
13 1 (0.091%) C
13 1 (0.091%) Embedded C
13 1 (0.091%) Embedded C++
13 1 (0.091%) VBScript
Qualifications
1 265 (24.09%) Degree
2 207 (18.82%) ACCA
2 207 (18.82%) CIMA
3 92 (8.36%) DBS Check
4 23 (2.09%) Security Cleared
5 20 (1.82%) CIPD
6 17 (1.55%) Master's Degree
7 16 (1.45%) SC Cleared
8 13 (1.18%) PMI Certification
9 11 (1.00%) ITIL Certification
10 7 (0.64%) CRISC
10 7 (0.64%) PMP
11 6 (0.55%) CISM
11 6 (0.55%) CISSP
12 4 (0.36%) Azure Certification
12 4 (0.36%) HNC
12 4 (0.36%) PRINCE2 Certification
12 4 (0.36%) PRINCE2 Practitioner
13 3 (0.27%) HND
13 3 (0.27%) Numerate Degree
Quality Assurance & Compliance
1 59 (5.36%) PMO
2 18 (1.64%) QA
3 17 (1.55%) SLA
4 16 (1.45%) Data Quality
5 15 (1.36%) Good Clinical Practice
6 14 (1.27%) GDPR
7 11 (1.00%) Accessibility
8 9 (0.82%) Sarbanes-Oxley
9 6 (0.55%) Actionable Recommendations
10 5 (0.45%) NIST
11 3 (0.27%) HIPAA
12 2 (0.18%) COBIT
12 2 (0.18%) GRC
12 2 (0.18%) ISO 9001
12 2 (0.18%) NEBOSH
12 2 (0.18%) PCI DSS
13 1 (0.091%) COSHH
13 1 (0.091%) GAAP
13 1 (0.091%) ISO 14001
System Software
1 44 (4.00%) Active Directory
2 21 (1.91%) VMware Infrastructure
3 6 (0.55%) Hyper-V
4 4 (0.36%) Docker
5 3 (0.27%) Oracle RAC
5 3 (0.27%) VirtualBox
6 1 (0.091%) Firmware
6 1 (0.091%) pfSense
6 1 (0.091%) Terminal Server
6 1 (0.091%) Virtual Desktop
Systems Management
1 9 (0.82%) Microsoft Intune
2 6 (0.55%) Kubernetes
3 3 (0.27%) Data Guard
3 3 (0.27%) Oracle RMAN
4 2 (0.18%) Ansible
4 2 (0.18%) Progress Chef
4 2 (0.18%) Puppet
5 1 (0.091%) Failover Clustering
Vendors
1 705 (64.09%) Microsoft
2 40 (3.64%) Oracle
3 30 (2.73%) SAP
4 25 (2.27%) VMware
5 13 (1.18%) Google
6 12 (1.09%) Citrix
6 12 (1.09%) Veeam
7 11 (1.00%) Nintex
7 11 (1.00%) Remedy
8 7 (0.64%) IBM
9 6 (0.55%) Cognos
9 6 (0.55%) Salesforce
10 5 (0.45%) Alteryx
10 5 (0.45%) Kronos
10 5 (0.45%) Palo Alto
10 5 (0.45%) Qualys
10 5 (0.45%) Sun
11 4 (0.36%) ServiceNow
12 3 (0.27%) Avaya
12 3 (0.27%) Reuters