Master's Degree Jobs in the South East

Master's Degree
England > South East

The table below provides summary statistics for permanent job vacancies advertised in the South East with a requirement for Master's Degree qualifications. It includes a benchmarking guide to the salaries offered over the 6 months leading up to 26 July 2024, comparing them to the same period in the previous two years.

6 months to
26 Jul 2024
Same period 2023 Same period 2022
Rank 148 52 170
Rank change year-on-year -96 +118 +71
Permanent jobs citing Master's Degree 252 598 478
As % of all permanent jobs advertised in the South East 1.67% 5.16% 2.17%
As % of the Qualifications category 5.23% 12.92% 5.79%
Number of salaries quoted 133 142 163
10th Percentile £34,800 £33,750 £36,953
25th Percentile £42,500 £41,250 £50,000
Median annual salary (50th Percentile) £60,000 £66,250 £60,000
Median % change year-on-year -9.43% +10.42% +20.00%
75th Percentile £75,000 £85,000 £73,750
90th Percentile £85,000 £94,750 £86,250
England median annual salary £65,000 £75,000 £65,000
% change year-on-year -13.33% +15.38% -

All Academic and Professional Certifications
South East

Master's Degree falls under the Academic Qualifications and Professional Certifications category. For comparison with the information above, the following table provides summary statistics for all permanent job vacancies requiring academic qualifications or professional certifications in the South East.

Permanent vacancies requiring academic qualifications or professional certifications 4,814 4,629 8,259
As % of all permanent jobs advertised in the South East 31.90% 39.95% 37.43%
Number of salaries quoted 2,888 2,312 3,312
10th Percentile £31,250 £29,250 £29,388
25th Percentile £40,000 £36,988 £37,500
Median annual salary (50th Percentile) £52,500 £52,000 £50,500
Median % change year-on-year +0.96% +2.97% +1.00%
75th Percentile £67,500 £66,250 £65,750
90th Percentile £83,750 £82,500 £80,000
England median annual salary £55,000 £60,000 £55,000
% change year-on-year -8.33% +9.09% -

Master's Degree
Job Vacancy Trend in the South East

Job postings citing Master's Degree as a proportion of all IT jobs advertised in the South East.
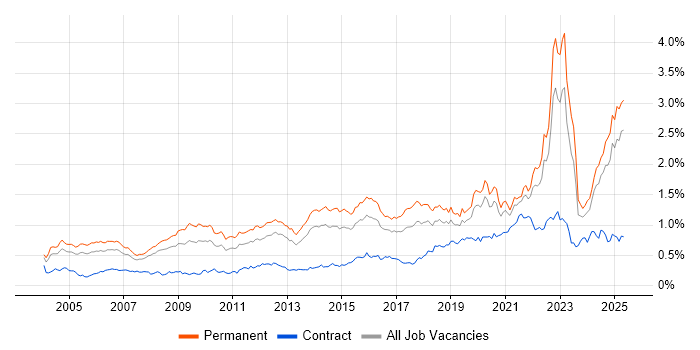
Job vacancy trend for Master's Degree in the South East

Master's Degree
Salary Trend in the South East

3-month moving average salary quoted in jobs citing Master's Degree in the South East.

Salary trend for Master's Degree in the South East

Master's Degree
Salary Histogram in the South East

Salary distribution for jobs citing Master's Degree in the South East over the 6 months to 26 July 2024.

Salary histogram for Master's Degree in the South East

Master's Degree
Job Locations in the South East

The table below looks at the demand and provides a guide to the median salaries quoted in IT jobs citing Master's Degree within the South East region over the 6 months to 26 July 2024. The 'Rank Change' column provides an indication of the change in demand within each location based on the same 6 month period last year.

Location Rank Change
on Same Period
Last Year
Matching
Permanent
IT Job Ads
Median Salary
Past 6 Months
Median Salary
% Change
on Same Period
Last Year
Live
Jobs
Thames Valley -15 150 £58,000 +5.45% 30
Berkshire +18 94 £58,000 +26.94% 16
Oxfordshire -18 41 £58,750 +23.68% 9
Surrey -57 34 £60,000 -7.69% 11
Kent -21 27 £65,000 +52.94% 8
Hampshire -110 24 £41,500 -44.67% 8
Buckinghamshire -37 15 £70,000 -22.22% 5
West Sussex -26 10 £64,000 -28.89% 1
East Sussex -38 6 £55,000 +15.79% 3
Master's Degree
England

Master's Degree
Co-occurring Skills and Capabilities in the South East by Category

The follow tables expand on the table above by listing co-occurrences grouped by category. The same employment type, locality and period is covered with up to 20 co-occurrences shown in each of the following categories:

Application Platforms
1 11 (4.37%) SharePoint
2 7 (2.78%) Apache
3 6 (2.38%) nginx
4 4 (1.59%) Apache Spark
5 2 (0.79%) SAS
Applications
1 17 (6.75%) Microsoft Excel
1 17 (6.75%) Microsoft Office
2 15 (5.95%) Microsoft PowerPoint
3 11 (4.37%) MS Visio
4 4 (1.59%) Microsoft Project
4 4 (1.59%) Spreadsheet
Business Applications
1 5 (1.98%) SAP S/4HANA
2 2 (0.79%) Primavera
Cloud Services
1 38 (15.08%) AWS
2 32 (12.70%) Azure
3 26 (10.32%) Power Platform
4 15 (5.95%) AWS Lambda
4 15 (5.95%) Serverless
5 11 (4.37%) GitHub
5 11 (4.37%) Microsoft 365
5 11 (4.37%) OneDrive
5 11 (4.37%) Power Automate
5 11 (4.37%) PowerApps
5 11 (4.37%) ShareGate
6 10 (3.97%) IaaS
6 10 (3.97%) PaaS
7 9 (3.57%) Cloud Computing
7 9 (3.57%) GCP
8 7 (2.78%) Azure Cosmos DB
8 7 (2.78%) Azure Functions
8 7 (2.78%) SaaS
9 6 (2.38%) GitHub Actions
9 6 (2.38%) Snowflake
Communications & Networking
1 15 (5.95%) 5G
1 15 (5.95%) Broadband
2 8 (3.17%) HTTP
3 4 (1.59%) 4G
3 4 (1.59%) WebEx
3 4 (1.59%) Wireless
4 3 (1.19%) Internet
4 3 (1.19%) Intranet
5 2 (0.79%) Firewall
5 2 (0.79%) SNMP
6 1 (0.40%) LAN
6 1 (0.40%) Network Security
6 1 (0.40%) RS-485
6 1 (0.40%) WAN
Database & Business Intelligence
1 26 (10.32%) Power BI
2 14 (5.56%) Big Data
3 13 (5.16%) SQL Server
4 11 (4.37%) GIS
4 11 (4.37%) Relational Database
5 9 (3.57%) Tableau
6 8 (3.17%) Data Mining
6 8 (3.17%) PostgreSQL
7 7 (2.78%) DynamoDB
7 7 (2.78%) MySQL
7 7 (2.78%) NoSQL
8 6 (2.38%) Data Warehouse
8 6 (2.38%) Redis
9 4 (1.59%) Amazon Athena
9 4 (1.59%) Hadoop
10 3 (1.19%) Amazon RDS
10 3 (1.19%) Azure SQL Database
10 3 (1.19%) Impala
10 3 (1.19%) Oracle Reports
11 2 (0.79%) Apache Hive
Development Applications
1 16 (6.35%) Git
2 9 (3.57%) JIRA
3 5 (1.98%) GitLab
4 3 (1.19%) Babel
4 3 (1.19%) CMake
4 3 (1.19%) Jenkins
4 3 (1.19%) Team Foundation Server
4 3 (1.19%) TestRail
4 3 (1.19%) webpack
5 2 (0.79%) ERwin
6 1 (0.40%) Cypress.io
6 1 (0.40%) Maven
6 1 (0.40%) Selenium
6 1 (0.40%) Subversion
6 1 (0.40%) WebDriver
General
1 107 (42.46%) Social Skills
2 58 (23.02%) Finance
3 54 (21.43%) Analytical Skills
4 40 (15.87%) Inclusion and Diversity
5 39 (15.48%) Marketing
6 32 (12.70%) Pharmaceutical
7 17 (6.75%) Manufacturing
7 17 (6.75%) Telecoms
8 14 (5.56%) Electronics
9 11 (4.37%) Law
10 9 (3.57%) Legal
11 7 (2.78%) Aerospace
11 7 (2.78%) Presentation Skills
11 7 (2.78%) Public Sector
12 4 (1.59%) Aeronautics
13 3 (1.19%) Banking
13 3 (1.19%) Organisational Skills
14 1 (0.40%) Automotive
14 1 (0.40%) Influencing Skills
Job Titles
1 66 (26.19%) Senior
2 51 (20.24%) Software Engineer
3 33 (13.10%) Developer
4 21 (8.33%) Senior Software Engineer
5 13 (5.16%) Associate Director
6 12 (4.76%) Lead
7 11 (4.37%) Graduate
7 11 (4.37%) Senior Developer
8 10 (3.97%) Architect
9 9 (3.57%) Data Scientist
9 9 (3.57%) Research Engineer
9 9 (3.57%) Software Developer
9 9 (3.57%) Systems Engineer
10 7 (2.78%) AWS Developer
10 7 (2.78%) Azure Developer
10 7 (2.78%) Backend Developer
10 7 (2.78%) Consultant
10 7 (2.78%) Research Software Engineer
10 7 (2.78%) Senior Software Developer
11 6 (2.38%) Senior Systems Engineer
Libraries, Frameworks & Software Standards
1 20 (7.94%) .NET
2 15 (5.95%) HTML
3 14 (5.56%) AngularJS
3 14 (5.56%) RESTful
4 13 (5.16%) React
5 11 (4.37%) Web Services
6 10 (3.97%) HTML5
7 9 (3.57%) CSS
8 8 (3.17%) Dask
8 8 (3.17%) Django
8 8 (3.17%) Flask
8 8 (3.17%) Vue
9 7 (2.78%) gRPC
9 7 (2.78%) NumPy
10 6 (2.38%) Celery
10 6 (2.38%) CSS3
10 6 (2.38%) GeoJSON
10 6 (2.38%) GeoPandas
10 6 (2.38%) LAPP Stack
11 5 (1.98%) jQuery
Miscellaneous
1 80 (31.75%) Algorithms
2 19 (7.54%) Management Information System
3 13 (5.16%) Cloud Native
4 11 (4.37%) Data Structures
4 11 (4.37%) IoT
4 11 (4.37%) Product Ownership
5 9 (3.57%) Taxonomies
6 8 (3.17%) Distributed Systems
6 8 (3.17%) Public Cloud
7 7 (2.78%) CUDA
8 6 (2.38%) FPGA
8 6 (2.38%) Self-Motivation
9 4 (1.59%) Onboarding
9 4 (1.59%) Virtual Team
10 3 (1.19%) Analytical Mindset
10 3 (1.19%) Data Centre
10 3 (1.19%) Data Protection Act
10 3 (1.19%) Driving Licence
10 3 (1.19%) FMCG
11 2 (0.79%) Fat Client
Operating Systems
1 69 (27.38%) Linux
2 38 (15.08%) Unix
3 22 (8.73%) Windows
4 2 (0.79%) VMS
5 1 (0.40%) Windows 10
5 1 (0.40%) Windows Server
5 1 (0.40%) Windows Server 2019
Processes & Methodologies
1 140 (55.56%) Computer Science
2 89 (35.32%) Problem-Solving
3 77 (30.56%) Mathematics
4 65 (25.79%) Agile
4 65 (25.79%) Software Engineering
5 61 (24.21%) Physics
6 50 (19.84%) DevOps
7 44 (17.46%) Business Intelligence
8 43 (17.06%) SDLC
9 42 (16.67%) Roadmaps
10 38 (15.08%) Analytics
10 38 (15.08%) Continuous Improvement
11 37 (14.68%) Software Testing
12 36 (14.29%) Machine Learning
13 35 (13.89%) Decision-Making
14 34 (13.49%) Mentoring
14 34 (13.49%) Parallel Programming
15 33 (13.10%) Validation
16 32 (12.70%) Performance Analysis
16 32 (12.70%) Project Management
Programming Languages
1 95 (37.70%) Python
2 54 (21.43%) C
3 45 (17.86%) C++
3 45 (17.86%) Fortran
4 35 (13.89%) C#
4 35 (13.89%) JavaScript
5 34 (13.49%) Bash
6 26 (10.32%) SQL
7 11 (4.37%) TypeScript
8 10 (3.97%) Java
9 8 (3.17%) MATLAB
10 7 (2.78%) R
11 6 (2.38%) Go
12 5 (1.98%) C-shell
13 4 (1.59%) PowerShell
14 3 (1.19%) AWK
14 3 (1.19%) Rust
14 3 (1.19%) sed
14 3 (1.19%) Shell Script
14 3 (1.19%) VB
Qualifications
1 252 (100.00%) Degree
2 89 (35.32%) PhD
3 68 (26.98%) Computer Science Degree
4 56 (22.22%) Security Cleared
5 40 (15.87%) MBA
6 14 (5.56%) AWS Certification
7 12 (4.76%) Numerate Degree
8 11 (4.37%) ITIL Certification
8 11 (4.37%) SC Cleared
9 5 (1.98%) BPSS Clearance
10 4 (1.59%) AWS Certified Solutions Architect
10 4 (1.59%) Cisco Certification
10 4 (1.59%) DBS Check
10 4 (1.59%) PMI Certification
10 4 (1.59%) PMP
11 3 (1.19%) Microsoft Certification
12 2 (0.79%) CCNA
12 2 (0.79%) Chartered Engineer
12 2 (0.79%) DV Cleared
12 2 (0.79%) PRINCE2 Practitioner
Quality Assurance & Compliance
1 24 (9.52%) GDPR
2 19 (7.54%) QA
3 14 (5.56%) Data Quality
4 13 (5.16%) Accessibility
5 10 (3.97%) HIPAA
6 9 (3.57%) California Consumer Privacy Act
7 6 (2.38%) ISO 13485
8 4 (1.59%) ISO/IEC 27001
9 3 (1.19%) PMO
9 3 (1.19%) SLA
10 2 (0.79%) PMBOK
11 1 (0.40%) NIST
11 1 (0.40%) NIST 800
11 1 (0.40%) SOC 2
System Software
1 16 (6.35%) Docker
2 11 (4.37%) Active Directory
3 6 (2.38%) Firmware
4 2 (0.79%) HDFS
4 2 (0.79%) Hyper-V
5 1 (0.40%) Microsoft Virtual Server
5 1 (0.40%) Virtual Servers
5 1 (0.40%) VMware ESXi
5 1 (0.40%) VMware Infrastructure
Systems Management
1 9 (3.57%) Terraform
2 8 (3.17%) Kubernetes
3 3 (1.19%) Ansible
4 1 (0.40%) SCCM
Vendors
1 64 (25.40%) Microsoft
2 15 (5.95%) Virgin Media
3 11 (4.37%) Nintex
3 11 (4.37%) SAP
4 8 (3.17%) MuleSoft
5 7 (2.78%) Atlassian
6 4 (1.59%) EMC
6 4 (1.59%) Oracle
7 3 (1.19%) Cloudera
7 3 (1.19%) Google
8 2 (0.79%) Adobe
8 2 (0.79%) Aruba
8 2 (0.79%) Cisco
8 2 (0.79%) Foundry
8 2 (0.79%) HP
8 2 (0.79%) IBM
8 2 (0.79%) Informatica
8 2 (0.79%) Palantir
8 2 (0.79%) Sage
8 2 (0.79%) Salesforce