Bash Jobs in the South East

Bash Shell
England > South East

The table below provides summary statistics for permanent job vacancies advertised in the South East requiring Bash skills. It includes a benchmarking guide to the annual salaries offered in vacancies that cited Bash over the 6 months leading up to 26 July 2024, comparing them to the same period in the previous two years.

6 months to
26 Jul 2024
Same period 2023 Same period 2022
Rank 156 140 179
Rank change year-on-year -16 +39 -15
Permanent jobs citing Bash 242 281 454
As % of all permanent jobs advertised in the South East 1.60% 2.42% 2.06%
As % of the Programming Languages category 5.67% 6.13% 4.59%
Number of salaries quoted 112 184 245
10th Percentile £37,500 £36,250 £32,500
25th Percentile £43,911 £41,250 £41,250
Median annual salary (50th Percentile) £55,000 £60,000 £55,065
Median % change year-on-year -8.33% +8.96% +0.12%
75th Percentile £63,750 £75,500 £76,250
90th Percentile £77,500 £80,000 £85,000
England median annual salary £62,500 £70,000 £70,000
% change year-on-year -10.71% - +12.00%

All Programming Languages
South East

Bash falls under the Programming Languages category. For comparison with the information above, the following table provides summary statistics for all permanent job vacancies requiring coding skills in the South East.

Permanent vacancies with a requirement for coding skills 4,268 4,582 9,889
As % of all permanent jobs advertised in the South East 28.28% 39.54% 44.82%
Number of salaries quoted 3,238 3,284 6,128
10th Percentile £35,500 £35,018 £33,750
25th Percentile £42,500 £45,250 £42,500
Median annual salary (50th Percentile) £55,000 £60,000 £55,000
Median % change year-on-year -8.33% +9.09% +10.00%
75th Percentile £68,000 £74,250 £72,500
90th Percentile £82,500 £87,500 £85,000
England median annual salary £60,000 £65,000 £62,500
% change year-on-year -7.69% +4.00% +8.70%

Bash
Job Vacancy Trend in the South East

Job postings citing Bash as a proportion of all IT jobs advertised in the South East.
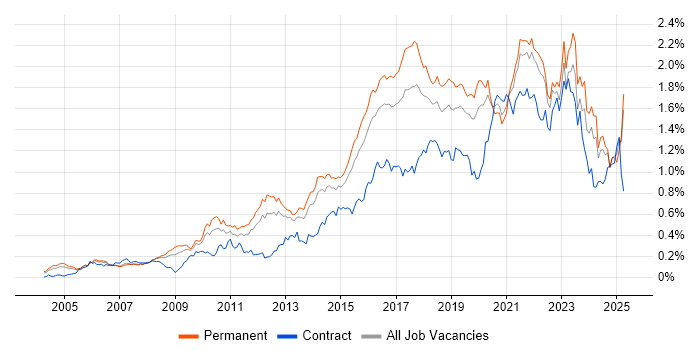
Job vacancy trend for Bash in the South East

Bash
Salary Trend in the South East

3-month moving average salary quoted in jobs citing Bash in the South East.

Salary trend for Bash in the South East

Bash
Salary Histogram in the South East

Salary distribution for jobs citing Bash in the South East over the 6 months to 26 July 2024.

Salary histogram for Bash in the South East

Bash
Job Locations in the South East

The table below looks at the demand and provides a guide to the median salaries quoted in IT jobs citing Bash within the South East region over the 6 months to 26 July 2024. The 'Rank Change' column provides an indication of the change in demand within each location based on the same 6 month period last year.

Location Rank Change
on Same Period
Last Year
Matching
Permanent
IT Job Ads
Median Salary
Past 6 Months
Median Salary
% Change
on Same Period
Last Year
Live
Jobs
Thames Valley -30 104 £55,000 -8.33% 7
Surrey +15 80 £60,000 +17.07% 2
Berkshire -27 62 £58,000 -14.07% 2
Hampshire -34 33 £62,500 +2.46% 3
Middlesex +4 31 - -
Oxfordshire 0 23 £44,089 -2.03% 1
Buckinghamshire -23 19 £55,000 +60.24% 4
West Sussex +10 2 £38,250 -41.15%
Kent -13 2 £110,000 +83.33% 1
Bash
England

Bash
Co-occurring Skills and Capabilities in the South East by Category

The follow tables expand on the table above by listing co-occurrences grouped by category. The same employment type, locality and period is covered with up to 20 co-occurrences shown in each of the following categories:

Application Platforms
1 11 (4.55%) OpenStack
2 7 (2.89%) Apache
3 6 (2.48%) Tomcat
4 1 (0.41%) Confluence
4 1 (0.41%) nginx
Applications
1 8 (3.31%) Microsoft Excel
2 1 (0.41%) Microsoft Office
Cloud Services
1 137 (56.61%) Azure
2 69 (28.51%) Entra ID
3 36 (14.88%) AWS
4 18 (7.44%) Cloud Computing
5 17 (7.02%) IaaS
6 16 (6.61%) GCP
7 12 (4.96%) Azure DevOps
8 11 (4.55%) Nutanix
9 7 (2.89%) GitHub
10 6 (2.48%) Microsoft 365
11 4 (1.65%) PaaS
12 3 (1.24%) SaaS
13 2 (0.83%) AWS CloudFormation
13 2 (0.83%) Power Platform
14 1 (0.41%) Akamai
14 1 (0.41%) AWS Lambda
14 1 (0.41%) Azure Pipelines
14 1 (0.41%) Azure Synapse Analytics
14 1 (0.41%) dbt
14 1 (0.41%) Virtual Private Cloud
Communications & Networking
1 68 (28.10%) 5G
2 67 (27.69%) Broadband
3 24 (9.92%) Firewall
4 14 (5.79%) DNS
5 10 (4.13%) LAN
6 9 (3.72%) WAN
7 7 (2.89%) Network Security
7 7 (2.89%) VPN
8 4 (1.65%) Modbus
8 4 (1.65%) SNMP
9 3 (1.24%) NAS
9 3 (1.24%) SAN
9 3 (1.24%) VLAN
10 2 (0.83%) DHCP
10 2 (0.83%) TCP/IP
10 2 (0.83%) Wireless
11 1 (0.41%) Internet
11 1 (0.41%) SSH
11 1 (0.41%) Wi-Fi
Database & Business Intelligence
1 8 (3.31%) MySQL
2 6 (2.48%) MariaDB
2 6 (2.48%) PostgreSQL
3 5 (2.07%) Enterprise Data Warehouse
3 5 (2.07%) InfluxDB
4 4 (1.65%) Big Data
4 4 (1.65%) Elasticsearch
5 2 (0.83%) Power BI
5 2 (0.83%) Relational Database
6 1 (0.41%) Amazon QuickSight
6 1 (0.41%) Amazon RDS
6 1 (0.41%) Amazon Redshift
6 1 (0.41%) Apache Cassandra
6 1 (0.41%) BigQuery
6 1 (0.41%) DynamoDB
6 1 (0.41%) Looker
6 1 (0.41%) MongoDB
6 1 (0.41%) NoSQL
6 1 (0.41%) Presto
6 1 (0.41%) Tableau
Development Applications
1 36 (14.88%) Jenkins
2 31 (12.81%) Git
3 28 (11.57%) JIRA
4 13 (5.37%) Robot Framework
5 9 (3.72%) CMake
5 9 (3.72%) GitLab
5 9 (3.72%) Team Foundation Server
5 9 (3.72%) TestRail
6 6 (2.48%) Artifactory
6 6 (2.48%) Bitbucket
7 5 (2.07%) JMeter
7 5 (2.07%) Maven
7 5 (2.07%) Selenium
7 5 (2.07%) SonarQube
7 5 (2.07%) Zephyr
8 2 (0.83%) Burp Suite
8 2 (0.83%) Metasploit
9 1 (0.41%) TeamCity
General
1 104 (42.98%) Analytical Skills
2 67 (27.69%) Inclusion and Diversity
3 55 (22.73%) Social Skills
4 16 (6.61%) Aerospace
5 15 (6.20%) Finance
6 9 (3.72%) Organisational Skills
7 6 (2.48%) Games
7 6 (2.48%) Retail
8 5 (2.07%) Aviation
8 5 (2.07%) Billing
8 5 (2.07%) Military
8 5 (2.07%) Swedish Language
9 2 (0.83%) Electronics
9 2 (0.83%) Tech for Good
10 1 (0.41%) Advertising
10 1 (0.41%) Documentation Skills
10 1 (0.41%) Law
10 1 (0.41%) Presentation Skills
Job Titles
1 81 (33.47%) Senior
2 68 (28.10%) Linux Specialist
3 67 (27.69%) Technical Specialist
4 59 (24.38%) Software Engineer
5 38 (15.70%) Senior Data Warehouse Specialist
5 38 (15.70%) Senior Linux Specialist
5 38 (15.70%) Senior Technical Specialist
5 38 (15.70%) Senior Unix Technical Specialist
6 24 (9.92%) Senior Software Engineer
7 21 (8.68%) DevOps Engineer
8 14 (5.79%) Infrastructure Engineer
9 13 (5.37%) Consultant
9 13 (5.37%) Software Consultant
10 12 (4.96%) Systems Engineer
11 10 (4.13%) Administrator
12 9 (3.72%) Senior Infrastructure Engineer
13 8 (3.31%) Graduate
13 8 (3.31%) Linux Engineer
14 7 (2.89%) Azure Engineer
14 7 (2.89%) Systems Administrator
Libraries, Frameworks & Software Standards
1 24 (9.92%) HTML
2 19 (7.85%) XML
3 10 (4.13%) Qt
4 9 (3.72%) EDI
4 9 (3.72%) HTML5
4 9 (3.72%) OpenCL
4 9 (3.72%) OpenGL
4 9 (3.72%) QML
4 9 (3.72%) VTK
4 9 (3.72%) Vulkan
4 9 (3.72%) WinForms
4 9 (3.72%) WPF
5 8 (3.31%) OpenMP
6 6 (2.48%) JSON
6 6 (2.48%) JSP
6 6 (2.48%) Web Services
7 5 (2.07%) OpenAPI
7 5 (2.07%) Swagger
8 4 (1.65%) ARM Templates
9 3 (1.24%) Elastic Stack
Miscellaneous
1 67 (27.69%) Social Media
2 40 (16.53%) Algorithms
3 22 (9.09%) Linux Command Line
4 17 (7.02%) CUDA
4 17 (7.02%) Self-Motivation
5 13 (5.37%) IoT
6 6 (2.48%) Life Science
6 6 (2.48%) NHS
7 5 (2.07%) Data Centre
7 5 (2.07%) PKI
7 5 (2.07%) Robotics
8 4 (1.65%) Distributed Systems
8 4 (1.65%) Management Information System
8 4 (1.65%) Raspberry Pi
9 3 (1.24%) Analytical Mindset
9 3 (1.24%) Distributed Computing
9 3 (1.24%) Wiki
10 2 (0.83%) Fat Client
10 2 (0.83%) Security Posture
10 2 (0.83%) Thin Client
Operating Systems
1 179 (73.97%) Linux
2 70 (28.93%) Ubuntu
3 37 (15.29%) Unix
3 37 (15.29%) Windows
4 12 (4.96%) Red Hat Enterprise Linux
5 10 (4.13%) CentOS
6 5 (2.07%) Windows 10
6 5 (2.07%) Windows Server 2012
6 5 (2.07%) Windows Server 2016
6 5 (2.07%) Windows Server 2019
7 4 (1.65%) Windows Server
8 2 (0.83%) Embedded Linux
8 2 (0.83%) VMS
9 1 (0.41%) Debian
Processes & Methodologies
1 98 (40.50%) Artificial Intelligence
2 89 (36.78%) Problem-Solving
3 80 (33.06%) Cybersecurity
4 71 (29.34%) CRM
5 70 (28.93%) Software Engineering
6 68 (28.10%) IT Strategy
7 67 (27.69%) Technology Strategy
8 63 (26.03%) DevOps
9 60 (24.79%) Software Testing
10 49 (20.25%) Computer Science
11 48 (19.83%) Physics
12 46 (19.01%) Mathematics
13 44 (18.18%) Open Source
14 41 (16.94%) SDLC
15 40 (16.53%) Agile
15 40 (16.53%) Performance Analysis
16 39 (16.12%) Containerisation
17 36 (14.88%) CI/CD
18 29 (11.98%) Parallel Programming
19 26 (10.74%) Configuration Management
Programming Languages
1 143 (59.09%) Python
2 51 (21.07%) C
3 46 (19.01%) Fortran
3 46 (19.01%) PowerShell
4 42 (17.36%) C++
5 28 (11.57%) Perl
6 18 (7.44%) Java
7 15 (6.20%) SQL
8 11 (4.55%) C#
8 11 (4.55%) C-shell
8 11 (4.55%) Ruby
9 10 (4.13%) JavaScript
10 6 (2.48%) PHP
11 5 (2.07%) Bicep
11 5 (2.07%) Groovy
12 4 (1.65%) Shell Script
13 3 (1.24%) MATLAB
14 1 (0.41%) Assembly Language
14 1 (0.41%) Korn
14 1 (0.41%) Tcl
Qualifications
1 76 (31.40%) Degree
2 62 (25.62%) Security Cleared
3 40 (16.53%) PhD
4 34 (14.05%) Master's Degree
5 19 (7.85%) Computer Science Degree
6 13 (5.37%) SC Cleared
7 7 (2.89%) DV Cleared
8 5 (2.07%) BPSS Clearance
8 5 (2.07%) CCNA
8 5 (2.07%) Cisco Certification
9 4 (1.65%) CTC Cleared
10 3 (1.24%) AWS Certification
10 3 (1.24%) Network+ Certification
11 2 (0.83%) Azure Certification
11 2 (0.83%) CEH
11 2 (0.83%) CompTIA Security+
11 2 (0.83%) OSCP
12 1 (0.41%) CISSP
12 1 (0.41%) HND
12 1 (0.41%) OSCE
Quality Assurance & Compliance
1 11 (4.55%) Data Quality
2 5 (2.07%) Solvency II
3 4 (1.65%) ISO/IEC 27001
3 4 (1.65%) PCI DSS
3 4 (1.65%) SLA
4 3 (1.24%) HIPAA
5 2 (0.83%) GDPR
5 2 (0.83%) Sarbanes-Oxley
6 1 (0.41%) ISO/IEC 15288
System Software
1 91 (37.60%) Active Directory
2 32 (13.22%) Docker
3 19 (7.85%) VMware Infrastructure
4 11 (4.55%) Virtual Machines
5 7 (2.89%) Hyper-V
6 5 (2.07%) Citrix Hypervisor
7 4 (1.65%) Firmware
Systems Management
1 68 (28.10%) Microsoft Intune
2 67 (27.69%) Jamf Pro
3 42 (17.36%) Kubernetes
4 24 (9.92%) Ansible
5 19 (7.85%) Terraform
6 11 (4.55%) Puppet
7 8 (3.31%) Grafana
8 5 (2.07%) Nagios
8 5 (2.07%) Red Hat Spacewalk
8 5 (2.07%) SELinux
9 4 (1.65%) Cacti
10 3 (1.24%) Docker Swarm
10 3 (1.24%) Progress Chef
10 3 (1.24%) Prometheus
11 2 (0.83%) Nmap
12 1 (0.41%) Graphite
12 1 (0.41%) Istio
12 1 (0.41%) Salt
12 1 (0.41%) systemd
12 1 (0.41%) ZABBIX
Vendors
1 134 (55.37%) Microsoft
2 67 (27.69%) CyberArk
2 67 (27.69%) Tanium
3 20 (8.26%) VMware
4 14 (5.79%) ServiceNow
5 7 (2.89%) Fortinet
6 6 (2.48%) Cisco
7 5 (2.07%) Juniper
7 5 (2.07%) Red Hat
7 5 (2.07%) Splunk
7 5 (2.07%) Veracode
8 4 (1.65%) IBM
9 2 (0.83%) ArcSight
9 2 (0.83%) LogRhythm
9 2 (0.83%) Palo Alto
9 2 (0.83%) Qualys
10 1 (0.41%) Google
10 1 (0.41%) New Relic
10 1 (0.41%) Ubiquiti
10 1 (0.41%) Vertica