Mentoring Jobs in the South West

Mentorship
England > South West

The table below provides summary statistics for permanent job vacancies advertised in the South West requiring Mentoring skills. It includes a benchmarking guide to the annual salaries offered in vacancies that cited Mentoring over the 6 months leading up to 30 May 2025, comparing them to the same period in the previous two years.

6 months to
30 May 2025
Same period 2024 Same period 2023
Rank 22 29 10
Rank change year-on-year +7 -19 +21
Permanent jobs citing Mentoring 291 612 958
As % of all permanent jobs advertised in the South West 8.27% 6.27% 14.26%
As % of the Processes & Methodologies category 8.88% 7.70% 15.07%
Number of salaries quoted 171 366 316
10th Percentile £29,750 £29,750 £34,644
25th Percentile £42,500 £42,500 £43,000
Median annual salary (50th Percentile) £58,000 £55,087 £55,000
Median % change year-on-year +5.29% +0.16% +3.55%
75th Percentile £73,818 £72,500 £75,125
90th Percentile £95,000 £90,967 £99,895
England median annual salary £65,000 £62,000 £70,000
% change year-on-year +4.84% -11.43% +8.71%

All Process and Methodology Skills
South West

Mentoring falls under the Processes and Methodologies category. For comparison with the information above, the following table provides summary statistics for all permanent job vacancies requiring process or methodology skills in the South West.

Permanent vacancies with a requirement for process or methodology skills 3,277 7,953 6,359
As % of all permanent jobs advertised in the South West 93.10% 81.43% 94.66%
Number of salaries quoted 1,844 5,709 3,498
10th Percentile £27,250 £28,500 £30,500
25th Percentile £35,000 £37,500 £39,750
Median annual salary (50th Percentile) £52,500 £50,500 £54,000
Median % change year-on-year +3.96% -6.48% +8.00%
75th Percentile £63,750 £65,000 £69,938
90th Percentile £78,750 £80,000 £81,250
England median annual salary £57,500 £55,000 £62,500
% change year-on-year +4.55% -12.00% +4.17%

Mentoring
Job Vacancy Trend in the South West

Job postings citing Mentoring as a proportion of all IT jobs advertised in the South West.
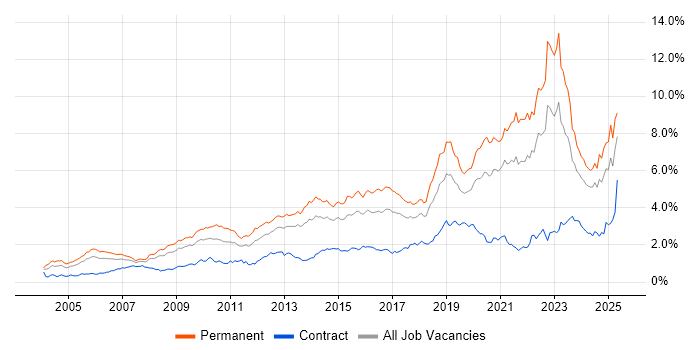
Job vacancy trend for Mentoring in the South West

Mentoring
Salary Trend in the South West

3-month moving average salary quoted in jobs citing Mentoring in the South West.

Salary trend for Mentoring in the South West

Mentoring
Salary Histogram in the South West

Salary distribution for jobs citing Mentoring in the South West over the 6 months to 30 May 2025.

Salary histogram for Mentoring in the South West

Mentoring
Job Locations in the South West

The table below looks at the demand and provides a guide to the median salaries quoted in IT jobs citing Mentoring within the South West region over the 6 months to 30 May 2025. The 'Rank Change' column provides an indication of the change in demand within each location based on the same 6 month period last year.

Location Rank Change
on Same Period
Last Year
Matching
Permanent
IT Job Ads
Median Salary
Past 6 Months
Median Salary
% Change
on Same Period
Last Year
Live
Jobs
Bristol +7 107 £67,500 +3.85% 203
Gloucestershire +14 66 £56,250 +7.14% 264
Devon +11 56 £61,500 +2.50% 242
Wiltshire +9 27 £57,500 +4.55% 133
Cornwall +12 16 £31,000 -22.50% 5
Somerset -12 10 £62,500 +54.32% 183
Dorset -14 7 £34,800 -33.71% 125
Mentoring
England

Mentoring
Co-occurring Skills and Capabilities in the South West by Category

The follow tables expand on the table above by listing co-occurrences grouped by category. The same employment type, locality and period is covered with up to 20 co-occurrences shown in each of the following categories:

Application Platforms
1 20 (6.87%) Jupyter
2 7 (2.41%) Apache
3 6 (2.06%) SharePoint
4 4 (1.37%) Microsoft Exchange
5 3 (1.03%) OpenStack
6 2 (0.69%) ArcGIS
7 1 (0.34%) Apache Airflow
7 1 (0.34%) Appian
7 1 (0.34%) CMS
7 1 (0.34%) Mendix
7 1 (0.34%) SharePoint 2013
7 1 (0.34%) Umbraco
7 1 (0.34%) WordPress
Applications
1 5 (1.72%) Microsoft Excel
2 4 (1.37%) Microsoft PowerPoint
3 3 (1.03%) Microsoft Office
4 1 (0.34%) Adobe XD
4 1 (0.34%) Elementor
Business Applications
1 5 (1.72%) NetSuite
2 1 (0.34%) BASE24
2 1 (0.34%) Dynamics AX
2 1 (0.34%) Dynamics CRM
2 1 (0.34%) SAP S/4HANA
2 1 (0.34%) Shopify
Cloud Services
1 60 (20.62%) Azure
2 58 (19.93%) AWS
3 31 (10.65%) GCP
4 16 (5.50%) Power Platform
5 12 (4.12%) Microsoft 365
5 12 (4.12%) Serverless
6 10 (3.44%) AWS Lambda
7 9 (3.09%) GitHub
8 7 (2.41%) Snowflake
9 6 (2.06%) Azure DevOps
9 6 (2.06%) Pulumi
10 4 (1.37%) Entra ID
10 4 (1.37%) OneDrive
10 4 (1.37%) Vertex AI
11 3 (1.03%) Amazon EKS
11 3 (1.03%) Amazon S3
11 3 (1.03%) AWS Step Functions
11 3 (1.03%) Dynamics 365
12 2 (0.69%) Azure Cosmos DB
12 2 (0.69%) Matillion
Communications & Networking
1 31 (10.65%) Broadband
2 26 (8.93%) Firewall
3 17 (5.84%) 5G
3 17 (5.84%) WAN
4 16 (5.50%) Wi-Fi
5 14 (4.81%) VPN
6 12 (4.12%) SD-WAN
6 12 (4.12%) VSAT
7 10 (3.44%) Wireless
8 8 (2.75%) Network Security
9 5 (1.72%) Bluetooth
9 5 (1.72%) Cisco Firepower
9 5 (1.72%) Cisco Nexus
9 5 (1.72%) GSM
9 5 (1.72%) LoRaWAN
9 5 (1.72%) LTE
9 5 (1.72%) Modbus
9 5 (1.72%) MPLS
9 5 (1.72%) TCP/IP
9 5 (1.72%) UMTS
Database & Business Intelligence
1 25 (8.59%) Big Data
2 15 (5.15%) NoSQL
2 15 (5.15%) Power BI
3 12 (4.12%) SQL Server
4 11 (3.78%) MongoDB
4 11 (3.78%) Relational Database
5 9 (3.09%) Data Warehouse
5 9 (3.09%) Tableau
6 7 (2.41%) Elasticsearch
6 7 (2.41%) RDBMS
7 6 (2.06%) BigQuery
8 5 (1.72%) Data Hub
8 5 (1.72%) Looker
8 5 (1.72%) MySQL
8 5 (1.72%) SQL Server Integration Services
9 4 (1.37%) Azure SQL Database
9 4 (1.37%) Data Lake
9 4 (1.37%) Qlik Sense
10 3 (1.03%) DynamoDB
10 3 (1.03%) PostgreSQL
Development Applications
1 19 (6.53%) Git
2 14 (4.81%) GitLab
3 6 (2.06%) Eclipse
3 6 (2.06%) Eclipse RCP
3 6 (2.06%) Jaeger
3 6 (2.06%) Jenkins
4 5 (1.72%) Sonatype Nexus
4 5 (1.72%) Subversion
4 5 (1.72%) Visual Studio
5 4 (1.37%) IBM UrbanCode
6 2 (0.69%) Burp Suite
6 2 (0.69%) Cucumber
6 2 (0.69%) Metasploit
7 1 (0.34%) CMake
7 1 (0.34%) Robot Framework
7 1 (0.34%) VersaTest
7 1 (0.34%) Visual Studio Code
7 1 (0.34%) WiX
General
1 79 (27.15%) Finance
2 61 (20.96%) Social Skills
3 40 (13.75%) Inclusion and Diversity
4 33 (11.34%) Analytical Skills
5 23 (7.90%) Banking
6 19 (6.53%) Electronics
7 15 (5.15%) Manufacturing
7 15 (5.15%) Marketing
8 10 (3.44%) Organisational Skills
8 10 (3.44%) Presentation Skills
8 10 (3.44%) Public Sector
9 8 (2.75%) Games
10 6 (2.06%) Aerospace
10 6 (2.06%) Retail
11 4 (1.37%) Advertising
11 4 (1.37%) Telecoms
12 3 (1.03%) Influencing Skills
12 3 (1.03%) Multimedia
13 2 (0.69%) Brand Awareness
13 2 (0.69%) Investment Banking
Job Titles
1 91 (31.27%) Senior
2 73 (25.09%) Lead
3 31 (10.65%) Developer
4 27 (9.28%) Software Engineer
5 25 (8.59%) Data Scientist
5 25 (8.59%) Senior Data Scientist
6 22 (7.56%) Principal Engineer
6 22 (7.56%) Principal Systems Engineer
7 15 (5.15%) DevOps Engineer
7 15 (5.15%) Support Engineer
8 14 (4.81%) Team Leader
8 14 (4.81%) Technical Leader
8 14 (4.81%) Technical Support
9 13 (4.47%) Senior Developer
9 13 (4.47%) Senior Manager
9 13 (4.47%) Technical Engineer
10 12 (4.12%) Analyst
10 12 (4.12%) Consultant
10 12 (4.12%) Engineering Manager
10 12 (4.12%) Technical Support Engineer
Libraries, Frameworks & Software Standards
1 13 (4.47%) React
2 12 (4.12%) .NET
3 10 (3.44%) HTML
4 9 (3.09%) AngularJS
4 9 (3.09%) CSS
5 8 (2.75%) GraphQL
6 7 (2.41%) Middleware
7 6 (2.06%) .NET Core
7 6 (2.06%) Elastic Stack
7 6 (2.06%) JSP
7 6 (2.06%) Kafka
7 6 (2.06%) Node.js
7 6 (2.06%) OpenTelemetry
7 6 (2.06%) Spring Boot
8 5 (1.72%) .NET Framework
8 5 (1.72%) Pandas
8 5 (1.72%) REST
8 5 (1.72%) RESTful
9 4 (1.37%) Hibernate
9 4 (1.37%) JSF
Miscellaneous
1 24 (8.25%) Algorithms
2 20 (6.87%) Cyberattack
3 15 (5.15%) Self-Motivation
4 12 (4.12%) Data Structures
4 12 (4.12%) Driving Licence
4 12 (4.12%) Management Information System
4 12 (4.12%) Self-Driving Car
5 8 (2.75%) Data Centre
6 7 (2.41%) Legacy Systems
7 6 (2.06%) e-Learning
7 6 (2.06%) SCADA
8 5 (1.72%) Cloud Native
8 5 (1.72%) IoT
8 5 (1.72%) Operational Technology
8 5 (1.72%) Reinsurance
9 4 (1.37%) CUDA
9 4 (1.37%) GNSS
9 4 (1.37%) Hybrid Cloud
9 4 (1.37%) Onboarding
9 4 (1.37%) Robotics
Operating Systems
1 28 (9.62%) Linux
2 19 (6.53%) Windows
3 6 (2.06%) Unix
4 5 (1.72%) Apple iOS
5 3 (1.03%) Windows Server
6 1 (0.34%) Ubuntu
Processes & Methodologies
1 104 (35.74%) Problem-Solving
2 74 (25.43%) Software Engineering
3 67 (23.02%) Agile
4 66 (22.68%) DevOps
5 62 (21.31%) Computer Science
6 59 (20.27%) Coaching
7 52 (17.87%) CI/CD
8 45 (15.46%) Roadmaps
9 41 (14.09%) Data Science
10 40 (13.75%) Artificial Intelligence
11 37 (12.71%) Microservices
12 35 (12.03%) Machine Learning
12 35 (12.03%) Validation
13 34 (11.68%) Product Management
14 33 (11.34%) Technical Leadership
14 33 (11.34%) Test Automation
15 31 (10.65%) Project Management
16 30 (10.31%) Decision-Making
17 26 (8.93%) Mathematics
18 25 (8.59%) Visualisation
Programming Languages
1 82 (28.18%) Python
2 60 (20.62%) Java
3 45 (15.46%) JavaScript
4 39 (13.40%) SQL
5 24 (8.25%) TypeScript
6 22 (7.56%) C#
7 21 (7.22%) Bash
8 13 (4.47%) C++
9 9 (3.09%) C
9 9 (3.09%) Go
9 9 (3.09%) PHP
10 5 (1.72%) T-SQL
11 4 (1.37%) Julia
11 4 (1.37%) PowerShell
11 4 (1.37%) R
11 4 (1.37%) VBA
12 3 (1.03%) Ada
12 3 (1.03%) Rust
13 1 (0.34%) Swift
13 1 (0.34%) X++
Qualifications
1 111 (38.14%) Degree
2 55 (18.90%) Security Cleared
3 41 (14.09%) Computer Science Degree
4 40 (13.75%) BPSS Clearance
5 27 (9.28%) DV Cleared
6 22 (7.56%) SC Cleared
7 20 (6.87%) Chartered Engineer
8 19 (6.53%) CCNA
8 19 (6.53%) Cisco Certification
9 15 (5.15%) CISSP
10 14 (4.81%) AWS Certification
11 12 (4.12%) JNCIA
12 7 (2.41%) CCNP
12 7 (2.41%) Microsoft Certification
13 6 (2.06%) CISM
13 6 (2.06%) MCITP
13 6 (2.06%) Network+ Certification
13 6 (2.06%) PhD
14 5 (1.72%) CCDA
14 5 (1.72%) HND
Quality Assurance & Compliance
1 12 (4.12%) PMO
2 11 (3.78%) QA
3 9 (3.09%) Accessibility
3 9 (3.09%) NIST
4 7 (2.41%) Data Quality
5 6 (2.06%) GDPR
5 6 (2.06%) NCSC
5 6 (2.06%) SLA
6 3 (1.03%) ISO/IEC 27001
7 2 (0.69%) Actionable Recommendations
7 2 (0.69%) Cyber Essentials
7 2 (0.69%) Cyber Essentials PLUS
7 2 (0.69%) HIPAA
8 1 (0.34%) Sarbanes-Oxley
8 1 (0.34%) SOC 2
System Software
1 49 (16.84%) Docker
2 7 (2.41%) Active Directory
3 4 (1.37%) Firmware
4 1 (0.34%) Hyper-V
4 1 (0.34%) Snort
4 1 (0.34%) Virtual Desktop
4 1 (0.34%) Virtual Machines
4 1 (0.34%) vSphere
4 1 (0.34%) XenApp
Systems Management
1 55 (18.90%) Kubernetes
2 16 (5.50%) Terraform
3 14 (4.81%) Ansible
4 9 (3.09%) Argo
4 9 (3.09%) Prometheus
5 6 (2.06%) Kustomize
6 5 (1.72%) CASB
6 5 (1.72%) Systems Management Server (SMS)
7 4 (1.37%) Kibana
7 4 (1.37%) Microsoft Intune
8 3 (1.03%) Grafana
9 2 (0.69%) Autotask
9 2 (0.69%) Nmap
10 1 (0.34%) Nagios
10 1 (0.34%) Progress Chef
10 1 (0.34%) Puppet
10 1 (0.34%) SCCM
Vendors
1 30 (10.31%) Microsoft
2 19 (6.53%) Google
3 10 (3.44%) Databricks
4 9 (3.09%) Meraki
5 8 (2.75%) Cisco
6 7 (2.41%) Fortinet
6 7 (2.41%) Oracle
6 7 (2.41%) Palo Alto
7 5 (1.72%) Aerohive Networks
7 5 (1.72%) Ekahau
7 5 (1.72%) Extreme Networks
7 5 (1.72%) F5
7 5 (1.72%) Juniper
7 5 (1.72%) Red Hat
7 5 (1.72%) SolarWinds
8 4 (1.37%) Atlassian
8 4 (1.37%) IBM
8 4 (1.37%) Intel
9 3 (1.03%) Graphcore
10 2 (0.69%) Dynatrace