HTTP Contracts with Hybrid/Remote/WFH Options

HTTP (Hypertext Transfer Protocol)
UK > Work from Home

The table below provides summary statistics for remote or hybrid contract work requiring HTTP skills. It includes a benchmarking guide to the contractor rates offered in vacancies that cited HTTP over the 6 months leading up to 1 May 2025, comparing them to the same period in the previous two years.

6 months to
1 May 2025
Same period 2024 Same period 2023
Rank 199 270 344
Rank change year-on-year +71 +74 +2
Contract jobs citing HTTP 105 75 134
As % of all contract jobs with a WFH option 1.06% 0.49% 0.52%
As % of the Communications & Networking category 10.07% 4.66% 4.54%
Number of daily rates quoted 84 50 97
10th Percentile £380 £348 £406
25th Percentile £452 £413 £495
Median daily rate (50th Percentile) £555 £463 £575
Median % change year-on-year +20.00% -19.57% +4.55%
75th Percentile £775 £600 £640
90th Percentile £838 £626 £775
UK median daily rate £580 £500 £575
% change year-on-year +16.00% -13.04% +4.55%
Number of hourly rates quoted 2 1 1
10th Percentile £46.43 - -
25th Percentile £47.44 £22.75 £64.50
Median hourly rate £54.75 £23.50 £67.00
Median % change year-on-year +132.98% -64.93% +43.19%
75th Percentile £61.81 £24.25 £69.50
90th Percentile £62.68 - -
UK median hourly rate £80.68 £45.88 £75.00
% change year-on-year +75.84% -38.83% +52.87%

All Communications and Computer Networking Skills
Work from Home

HTTP falls under the Communications and Computer Networking category. For comparison with the information above, the following table provides summary statistics for all contract job vacancies with remote or hybrid options requiring communications or computer networking skills.

Contract vacancies with a requirement for communications or computer networking skills 1,043 1,610 2,954
As % of all contract jobs with a WFH option 10.53% 10.49% 11.42%
Number of daily rates quoted 667 1,029 1,967
10th Percentile £325 £300 £350
25th Percentile £400 £410 £425
Median daily rate (50th Percentile) £500 £505 £525
Median % change year-on-year -0.99% -3.81% +5.00%
75th Percentile £600 £615 £650
90th Percentile £700 £703 £725
UK median daily rate £488 £495 £519
% change year-on-year -1.52% -4.53% +3.70%
Number of hourly rates quoted 31 77 101
10th Percentile £13.78 £12.75 £24.50
25th Percentile £14.20 £14.27 £42.50
Median hourly rate £41.00 £24.50 £60.00
Median % change year-on-year +67.35% -59.17% +23.51%
75th Percentile £64.38 £65.00 £71.50
90th Percentile £73.75 £87.46 £80.25
UK median hourly rate £29.00 £40.00 £19.00
% change year-on-year -27.50% +110.53% -32.74%

HTTP
Trend for Jobs with a WFH Option

Job vacancies with remote working options citing HTTP as a proportion of all IT jobs advertised.
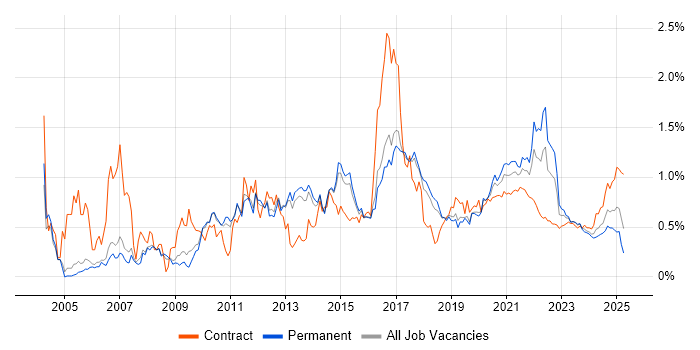
HTTP trend for jobs with Hybrid/Remote/WFH options

HTTP
Daily Rate Trend for Jobs with a WFH Option

3-month moving average daily rate quoted in job vacancies with remote working options citing HTTP.

HTTP daily rate for jobs with a WFH option

HTTP
Daily Rate Histogram for Jobs with a WFH Option

Daily rate distribution for jobs with remote working options citing HTTP over the 6 months to 1 May 2025.

HTTP daily rate histogram for jobs with a WFH option

HTTP
Hourly Rate Trend for Jobs with a WFH Option

3-month moving average hourly rate quoted in job vacancies with remote working options citing HTTP.

HTTP hourly rate for jobs with a WFH option

HTTP
Co-occurring Skills and Capabilities with WFH Options by Category

The follow tables expand on the table above by listing co-occurrences grouped by category. The same employment type, locality and period is covered with up to 20 co-occurrences shown in each of the following categories:

Application Platforms
1 10 (9.52%) Confluence
2 8 (7.62%) nginx
3 5 (4.76%) NetWeaver
4 4 (3.81%) Apache
4 4 (3.81%) Apache Spark
4 4 (3.81%) OpenStack
5 2 (1.90%) IIS
6 1 (0.95%) BizTalk Server
6 1 (0.95%) Microsoft Exchange
6 1 (0.95%) SharePoint
6 1 (0.95%) Tomcat
Applications
1 2 (1.90%) MS Visio
Cloud Services
1 57 (54.29%) AWS
2 40 (38.10%) Azure
3 38 (36.19%) AWS CloudFormation
4 26 (24.76%) GCP
5 22 (20.95%) SaaS
6 19 (18.10%) IaaS
6 19 (18.10%) PaaS
7 12 (11.43%) Cloud Computing
7 12 (11.43%) GitHub
8 10 (9.52%) Amazon EC2
8 10 (9.52%) Amazon EKS
9 9 (8.57%) AWS Lambda
9 9 (8.57%) Azure DevOps
9 9 (8.57%) Serverless
10 8 (7.62%) Amazon SQS
11 7 (6.67%) npm
12 6 (5.71%) Azure Monitor
12 6 (5.71%) Slack
13 5 (4.76%) Amazon ECS
14 4 (3.81%) Azure Sentinel
Communications & Networking
1 43 (40.95%) TCP/IP
2 40 (38.10%) DNS
3 28 (26.67%) Firewall
4 24 (22.86%) DHCP
5 23 (21.90%) HTTPS
6 20 (19.05%) BGP
6 20 (19.05%) OSPF
7 11 (10.48%) SMTP
8 9 (8.57%) SSL
9 8 (7.62%) Internet
10 6 (5.71%) FTP
11 5 (4.76%) VPN
12 4 (3.81%) Reverse Proxy
13 3 (2.86%) SNMP
14 2 (1.90%) POP3
15 1 (0.95%) DWDM
15 1 (0.95%) IGRP
15 1 (0.95%) Kerberos
15 1 (0.95%) LAN
15 1 (0.95%) WAN
Database & Business Intelligence
1 16 (15.24%) PostgreSQL
2 10 (9.52%) Amazon RDS
3 9 (8.57%) Amazon Aurora
3 9 (8.57%) DynamoDB
3 9 (8.57%) MongoDB
4 8 (7.62%) MySQL
5 6 (5.71%) Apache Cassandra
6 5 (4.76%) SQL Server
7 4 (3.81%) Apache Hive
7 4 (3.81%) Apache Iceberg
7 4 (3.81%) Hadoop
7 4 (3.81%) Parquet
7 4 (3.81%) Presto
8 3 (2.86%) Power BI
9 2 (1.90%) Redis
9 2 (1.90%) Relational Database
10 1 (0.95%) NoSQL
10 1 (0.95%) Oracle Database
Development Applications
1 25 (23.81%) Git
2 21 (20.00%) Jenkins
3 16 (15.24%) JIRA
4 13 (12.38%) GitLab
5 7 (6.67%) webpack
6 6 (5.71%) Cucumber
6 6 (5.71%) Jasmine
6 6 (5.71%) JUnit
7 5 (4.76%) Bitbucket
7 5 (4.76%) git-flow
8 4 (3.81%) Poetry
9 3 (2.86%) Cypress.io
9 3 (2.86%) Mocha
9 3 (2.86%) Postman
9 3 (2.86%) Visual Studio Code
10 1 (0.95%) Browser DevTools
10 1 (0.95%) Introscope
10 1 (0.95%) LoadRunner
10 1 (0.95%) SonarQube
10 1 (0.95%) Subversion
General
1 11 (10.48%) Banking
2 9 (8.57%) Social Skills
3 8 (7.62%) Finance
4 7 (6.67%) Analytical Skills
5 4 (3.81%) Telecoms
6 2 (1.90%) Documentation Skills
7 1 (0.95%) Advertising
7 1 (0.95%) Financial Institution
7 1 (0.95%) Front Office
7 1 (0.95%) Inclusion and Diversity
7 1 (0.95%) Legal
7 1 (0.95%) Marketing
7 1 (0.95%) Public Sector
7 1 (0.95%) Retail
Job Titles
1 33 (31.43%) Developer
2 26 (24.76%) Architect
3 18 (17.14%) Cloud Architect
3 18 (17.14%) Cloud Native Architect
3 18 (17.14%) Technical Architect
4 17 (16.19%) Senior
5 16 (15.24%) DevOps Engineer
6 11 (10.48%) AWS Engineer
7 10 (9.52%) AWS Architect
7 10 (9.52%) Security Architect
8 9 (8.57%) AWS DevOps
8 9 (8.57%) Network Security Architect
8 9 (8.57%) Security Technical Architect
9 8 (7.62%) AWS DevOps Engineer
9 8 (7.62%) Senior DevOps
9 8 (7.62%) Site Reliability Engineer
10 7 (6.67%) Senior DevOps Engineer
10 7 (6.67%) Site Engineer
11 6 (5.71%) Node.js Developer
11 6 (5.71%) Senior Developer
Libraries, Frameworks & Software Standards
1 28 (26.67%) REST
2 23 (21.90%) HTML
3 21 (20.00%) CSS
4 18 (17.14%) RESTful
5 17 (16.19%) Elastic Stack
6 16 (15.24%) React
6 16 (15.24%) Web Services
7 15 (14.29%) SOAP
8 13 (12.38%) XML
9 12 (11.43%) Node.js
9 12 (11.43%) OpenAPI
9 12 (11.43%) Swagger
10 11 (10.48%) JSON
11 10 (9.52%) .NET
12 9 (8.57%) AngularJS
12 9 (8.57%) Jest
13 8 (7.62%) AWS CDK
13 8 (7.62%) WebSockets
14 7 (6.67%) OAuth
14 7 (6.67%) XSLT
Miscellaneous
1 24 (22.86%) Cloud Native
2 8 (7.62%) Distributed Systems
3 6 (5.71%) Distributed Denial-of-Service
4 5 (4.76%) CMDB
4 5 (4.76%) Legacy Applications
4 5 (4.76%) Virtual Team
5 4 (3.81%) Cyber Threat
6 3 (2.86%) Algorithms
6 3 (2.86%) Cyberattack
6 3 (2.86%) Data Structures
6 3 (2.86%) Management Information System
6 3 (2.86%) Mobile App
6 3 (2.86%) PKI
6 3 (2.86%) Security Posture
6 3 (2.86%) Vector Graphics
7 2 (1.90%) Product Ownership
7 2 (1.90%) Security Operations Centre
8 1 (0.95%) Enterprise Software
8 1 (0.95%) Marketing Technology
8 1 (0.95%) Self-Motivation
Operating Systems
1 35 (33.33%) Linux
2 9 (8.57%) Unix
3 7 (6.67%) Red Hat Enterprise Linux
4 6 (5.71%) Windows
5 3 (2.86%) Mac OS X
6 2 (1.90%) Windows Server
7 1 (0.95%) AIX
7 1 (0.95%) CentOS
Processes & Methodologies
1 39 (37.14%) Test Automation
2 38 (36.19%) DevOps
3 37 (35.24%) Infrastructure as Code
4 36 (34.29%) CI/CD
5 26 (24.76%) Agile
6 24 (22.86%) Containerisation
7 21 (20.00%) Microservices
8 19 (18.10%) Continuous Integration
8 19 (18.10%) Sprint Planning
9 17 (16.19%) Mentoring
10 16 (15.24%) High Availability
10 16 (15.24%) Scrum
11 15 (14.29%) Configuration Management
11 15 (14.29%) SDLC
12 12 (11.43%) Software Engineering
13 11 (10.48%) Full-Stack Development
13 11 (10.48%) Incident Management
13 11 (10.48%) Problem-Solving
13 11 (10.48%) Site Reliability Engineering
14 10 (9.52%) Technical Leadership
Programming Languages
1 31 (29.52%) Python
2 29 (27.62%) JavaScript
3 21 (20.00%) Java
4 20 (19.05%) Bicep
4 20 (19.05%) SQL
5 12 (11.43%) Bash
6 11 (10.48%) TypeScript
7 9 (8.57%) PowerShell
8 8 (7.62%) C#
9 6 (5.71%) Groovy
10 5 (4.76%) ABAP
10 5 (4.76%) Shell Script
10 5 (4.76%) T-SQL
11 3 (2.86%) Go
11 3 (2.86%) Kusto Query Language
12 2 (1.90%) ActionScript
12 2 (1.90%) ActionScript 2.0
12 2 (1.90%) Perl
13 1 (0.95%) PHP
13 1 (0.95%) VB
Qualifications
1 17 (16.19%) Security Cleared
2 16 (15.24%) SC Cleared
3 4 (3.81%) Cisco Certification
3 4 (3.81%) Degree
4 2 (1.90%) (ISC)2 CCSP
4 2 (1.90%) AWS Certification
4 2 (1.90%) AWS Certified DevOps Engineer
4 2 (1.90%) CEH
4 2 (1.90%) CISSP
4 2 (1.90%) DV Cleared
5 1 (0.95%) BPSS Clearance
5 1 (0.95%) CCDP
5 1 (0.95%) CCNA
5 1 (0.95%) CCNP
5 1 (0.95%) CCSP
5 1 (0.95%) CompTIA CySA+
5 1 (0.95%) CompTIA Security+
5 1 (0.95%) GCIH
5 1 (0.95%) OSCP
Quality Assurance & Compliance
1 1 (0.95%) Accessibility
1 1 (0.95%) Data Quality
1 1 (0.95%) GDPR
1 1 (0.95%) HIPAA
1 1 (0.95%) PCI DSS
1 1 (0.95%) WCAG
System Software
1 34 (32.38%) Docker
2 2 (1.90%) Active Directory
2 2 (1.90%) OpenAM
2 2 (1.90%) OpenDJ
2 2 (1.90%) OpenIDM
Systems Management
1 39 (37.14%) Terraform
2 36 (34.29%) Kubernetes
3 16 (15.24%) Ansible
4 14 (13.33%) Grafana
5 12 (11.43%) Progress Chef
5 12 (11.43%) Prometheus
6 10 (9.52%) Puppet
7 2 (1.90%) Single Sign-On
8 1 (0.95%) CA Wily
8 1 (0.95%) CSIRT
8 1 (0.95%) FortiGate
8 1 (0.95%) Packer
8 1 (0.95%) SCOM
Vendors
1 20 (19.05%) Cisco
2 19 (18.10%) Fortinet
2 19 (18.10%) Palo Alto
3 18 (17.14%) CheckPoint
4 9 (8.57%) Red Hat
5 8 (7.62%) Microsoft
5 8 (7.62%) ServiceNow
5 8 (7.62%) Splunk
6 6 (5.71%) ForgeRock
6 6 (5.71%) SAP
7 5 (4.76%) AppDynamics
7 5 (4.76%) Dynatrace
7 5 (4.76%) Google
8 2 (1.90%) Arista
8 2 (1.90%) F5
8 2 (1.90%) Oracle
9 1 (0.95%) Citrix
9 1 (0.95%) HP
9 1 (0.95%) IBM
9 1 (0.95%) Juniper