e-Learning Jobs in London

e-Learning
England > London

The table below looks at the prevalence of the term e-Learning in permanent job vacancies advertised in London. Included is a benchmarking guide to the salaries offered in vacancies that have cited e-Learning over the 6 months to 27 April 2024 with a comparison to the same period over the previous 2 years.

6 months to
27 Apr 2024
Same period 2023 Same period 2022
Rank 445 582 618
Rank change year-on-year +137 +36 -71
Permanent jobs citing e-Learning 63 58 255
As % of all permanent jobs advertised in London 0.27% 0.16% 0.39%
As % of the Miscellaneous category 0.67% 0.35% 0.78%
Number of salaries quoted 39 43 94
10th Percentile £28,624 £38,800 £31,000
25th Percentile £38,000 £44,500 £41,250
Median annual salary (50th Percentile) £57,500 £47,500 £50,000
Median % change year-on-year +21.05% -5.00% -9.09%
75th Percentile £85,000 £61,250 £67,813
90th Percentile £90,000 £62,500 £82,500
England median annual salary £40,000 £48,750 £46,000
% change year-on-year -17.95% +5.98% +2.22%

All Generic Skills
London

e-Learning is in the General and Transferable Skills category. The following table is for comparison with the above and provides summary statistics for all permanent job vacancies advertised in London with a requirement for generic IT skills.

Permanent vacancies with a requirement for generic IT skills 9,444 16,554 32,551
As % of all permanent jobs advertised in London 40.23% 46.22% 49.81%
Number of salaries quoted 6,719 11,032 15,382
10th Percentile £37,500 £44,192 £45,000
25th Percentile £52,000 £56,250 £56,250
Median annual salary (50th Percentile) £75,000 £75,000 £75,000
Median % change year-on-year - - +3.45%
75th Percentile £100,000 £100,000 £96,250
90th Percentile £126,250 £122,500 £120,000
England median annual salary £55,000 £65,000 £62,500
% change year-on-year -15.38% +4.00% +4.17%

e-Learning
Job Vacancy Trend in London

Job postings citing e-Learning as a proportion of all IT jobs advertised in London.
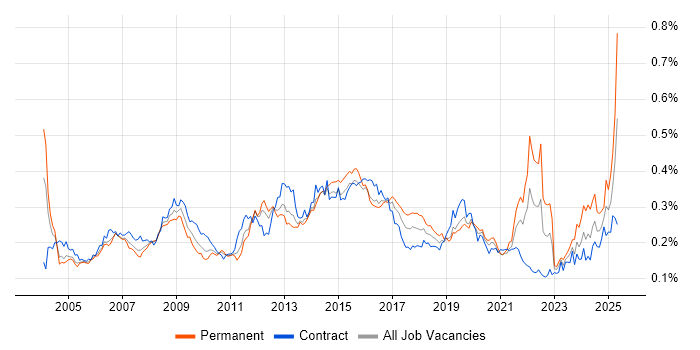
Job vacancy trend for e-Learning in London

e-Learning
Salary Trend in London

3-month moving average salary quoted in jobs citing e-Learning in London.

Salary trend for e-Learning in London

e-Learning
Salary Histogram in London

Salary distribution for jobs citing e-Learning in London over the 6 months to 27 April 2024.

Salary histogram for e-Learning in London

e-Learning
Job Locations in London

The table below looks at the demand and provides a guide to the median salaries quoted in IT jobs citing e-Learning within the London region over the 6 months to 27 April 2024. The 'Rank Change' column provides an indication of the change in demand within each location based on the same 6 month period last year.

Location Rank Change
on Same Period
Last Year
Matching
Permanent
IT Job Ads
Median Salary
Past 6 Months
Median Salary
% Change
on Same Period
Last Year
Live
Jobs
Central London +35 5 £72,500 +26.09% 6
e-Learning
England

e-Learning
Co-occurring Skills and Capabilities in London by Category

The follow tables expand on the table above by listing co-occurrences grouped by category. The same employment type, locality and period is covered with up to 20 co-occurrences shown in each of the following categories:

Application Platforms
1 9 (14.29%) CMS
2 3 (4.76%) Moodle
3 2 (3.17%) Camunda
3 2 (3.17%) Drupal
3 2 (3.17%) Joomla!
3 2 (3.17%) nginx
3 2 (3.17%) Umbraco
3 2 (3.17%) WordPress
4 1 (1.59%) SharePoint
Applications
1 10 (15.87%) AutoCAD
1 10 (15.87%) Revit
2 7 (11.11%) Microsoft Office
3 5 (7.94%) Oracle Smart View
4 4 (6.35%) Adobe Illustrator
4 4 (6.35%) Photoshop
5 3 (4.76%) Adobe After Effects
5 3 (4.76%) Adobe Premiere
6 2 (3.17%) Camtasia
6 2 (3.17%) Microsoft Excel
6 2 (3.17%) Microsoft PowerPoint
7 1 (1.59%) Adobe Captivate
7 1 (1.59%) Adobe Creative Suite
Business Applications
1 5 (7.94%) HFM
1 5 (7.94%) Hyperion Planning
2 1 (1.59%) SAP HCM
Cloud Services
1 14 (22.22%) Adobe Creative Cloud
2 12 (19.05%) AWS
2 12 (19.05%) IBM Cloud
3 11 (17.46%) OpenShift
4 10 (15.87%) Amazon ECR
4 10 (15.87%) Amazon EKS
4 10 (15.87%) Amazon S3
4 10 (15.87%) OCI
4 10 (15.87%) Route 53
5 2 (3.17%) ClickUp
6 1 (1.59%) GCP
6 1 (1.59%) GitHub
6 1 (1.59%) Google Analytics
6 1 (1.59%) Microsoft 365
6 1 (1.59%) OneDrive
6 1 (1.59%) SaaS
6 1 (1.59%) SuccessFactors
Communications & Networking
1 2 (3.17%) WebEx
Database & Business Intelligence
1 12 (19.05%) MongoDB
2 10 (15.87%) Amazon RDS
3 9 (14.29%) DB2
3 9 (14.29%) RDBMS
3 9 (14.29%) Relational Database
3 9 (14.29%) SQL Server
4 2 (3.17%) Metadata
4 2 (3.17%) MySQL
4 2 (3.17%) Oracle Database
5 1 (1.59%) BigQuery
5 1 (1.59%) Data Warehouse
5 1 (1.59%) Looker
5 1 (1.59%) ThoughtSpot
Development Applications
1 9 (14.29%) Jenkins
General
1 22 (34.92%) Social Skills
2 16 (25.40%) Inclusion and Diversity
3 15 (23.81%) Legal
4 14 (22.22%) Games
5 12 (19.05%) Public Sector
6 9 (14.29%) Finance
6 9 (14.29%) Organisational Skills
7 8 (12.70%) Analytical Skills
8 5 (7.94%) Law
8 5 (7.94%) Marketing
9 2 (3.17%) Influencing Skills
9 2 (3.17%) Multimedia
9 2 (3.17%) Publishing
9 2 (3.17%) Retail
10 1 (1.59%) French Language
10 1 (1.59%) German Language
10 1 (1.59%) Presentation Skills
Job Titles
1 19 (30.16%) Senior
2 10 (15.87%) DevOps Engineer
2 10 (15.87%) Head of IT
3 8 (12.70%) Senior DevOps
3 8 (12.70%) Senior DevOps Engineer
4 7 (11.11%) Developer
5 4 (6.35%) Administrator
5 4 (6.35%) Hyperion Specialist
6 3 (4.76%) Analyst
6 3 (4.76%) Communications Officer
6 3 (4.76%) Development Manager
6 3 (4.76%) Project Manager
6 3 (4.76%) Senior Communications Officer
6 3 (4.76%) Senior Developer
7 2 (3.17%) e-Learning Developer
7 2 (3.17%) IT Trainer
7 2 (3.17%) Senior Analyst
7 2 (3.17%) Senior Manager
7 2 (3.17%) Senior Project Manager
7 2 (3.17%) Trainer
Libraries, Frameworks & Software Standards
1 10 (15.87%) Unreal Engine
1 10 (15.87%) V-Ray
2 9 (14.29%) .NET
2 9 (14.29%) Spring
2 9 (14.29%) Spring XD
3 4 (6.35%) Node.js
3 4 (6.35%) React
4 3 (4.76%) HTML
4 3 (4.76%) HTML5
5 2 (3.17%) KeystoneJS
5 2 (3.17%) Swagger
5 2 (3.17%) Symfony
6 1 (1.59%) CSS
6 1 (1.59%) Jest
6 1 (1.59%) Redux
6 1 (1.59%) Unity (Game Engine)
Miscellaneous
1 12 (19.05%) Blockchain
1 12 (19.05%) Hybrid Cloud
2 11 (17.46%) Video Conferencing
3 10 (15.87%) Augmented Reality
3 10 (15.87%) HoloLens
3 10 (15.87%) HTC Vive
3 10 (15.87%) Oculus
3 10 (15.87%) Virtual Reality
4 7 (11.11%) Video Editing
5 6 (9.52%) Social Media
6 4 (6.35%) Management Information System
7 3 (4.76%) Blog
7 3 (4.76%) Data Protection Act
7 3 (4.76%) Graphic Design
7 3 (4.76%) SCORM
8 2 (3.17%) iPhone
8 2 (3.17%) Learning Management System
8 2 (3.17%) Onboarding
8 2 (3.17%) VLE
9 1 (1.59%) Product Ownership
Operating Systems
1 14 (22.22%) Windows
2 3 (4.76%) Android
2 3 (4.76%) Windows 10
3 1 (1.59%) Apple iOS
Processes & Methodologies
1 24 (38.10%) Mentoring
2 18 (28.57%) Coaching
3 14 (22.22%) Agile
3 14 (22.22%) Cybersecurity
3 14 (22.22%) Technology Strategy
4 13 (20.63%) Project Management
5 12 (19.05%) Artificial Intelligence
6 11 (17.46%) Software Testing
7 10 (15.87%) Containerisation
7 10 (15.87%) DevOps
7 10 (15.87%) IT Strategy
7 10 (15.87%) Migration
7 10 (15.87%) Observability
7 10 (15.87%) Secrets Management
7 10 (15.87%) Technical Leadership
7 10 (15.87%) Test Automation
8 9 (14.29%) CI/CD
8 9 (14.29%) Content Management
8 9 (14.29%) Refactoring
9 8 (12.70%) Analytics
Programming Languages
1 11 (17.46%) Java
2 5 (7.94%) JavaScript
3 2 (3.17%) Lua
3 2 (3.17%) PHP
4 1 (1.59%) C#
4 1 (1.59%) SQL
4 1 (1.59%) TypeScript
Qualifications
1 23 (36.51%) Degree
2 2 (3.17%) CISA
2 2 (3.17%) Computer Science Degree
2 2 (3.17%) CRISC
2 2 (3.17%) ISACA
2 2 (3.17%) Master's Degree
3 1 (1.59%) CISM
Quality Assurance & Compliance
1 12 (19.05%) GDPR
2 5 (7.94%) QA
3 2 (3.17%) Accessibility
3 2 (3.17%) NIST
4 1 (1.59%) Cyber Essentials
System Software
1 11 (17.46%) Docker
Systems Management
1 10 (15.87%) Kubernetes
1 10 (15.87%) Prometheus
1 10 (15.87%) Terraform
Vendors
1 14 (22.22%) Adobe
2 12 (19.05%) IBM
2 12 (19.05%) Red Hat
3 11 (17.46%) Oracle
4 10 (15.87%) Autodesk
4 10 (15.87%) Dynatrace
5 9 (14.29%) Microsoft
5 9 (14.29%) Sybase
6 5 (7.94%) Hyperion
7 3 (4.76%) Google
7 3 (4.76%) iManage
8 2 (3.17%) Apple
8 2 (3.17%) Cisco
9 1 (1.59%) Blackboard
9 1 (1.59%) Intapp
9 1 (1.59%) Salesforce
9 1 (1.59%) SAP