SDLC Jobs in London

Systems or Software Development Life Cycle (SDLC)
England > London

The table below provides summary statistics for permanent job vacancies advertised in London requiring SDLC skills. It includes a benchmarking guide to the annual salaries offered in vacancies that cited SDLC over the 6 months leading up to 31 May 2025, comparing them to the same period in the previous two years.

6 months to
31 May 2025
Same period 2024 Same period 2023
Rank 87 130 59
Rank change year-on-year +43 -71 +11
Permanent jobs citing SDLC 464 576 1,651
As % of all permanent jobs advertised in London 3.63% 2.40% 5.13%
As % of the Processes & Methodologies category 3.77% 2.66% 5.39%
Number of salaries quoted 206 381 1,001
10th Percentile £53,125 £50,500 £51,250
25th Percentile £61,563 £62,500 £58,750
Median annual salary (50th Percentile) £75,000 £80,000 £75,000
Median % change year-on-year -6.25% +6.67% -
75th Percentile £100,000 £106,250 £94,504
90th Percentile £120,000 £122,500 £115,000
England median annual salary £60,000 £60,000 £60,800
% change year-on-year - -1.32% -6.46%

All Process and Methodology Skills
London

SDLC falls under the Processes and Methodologies category. For comparison with the information above, the following table provides summary statistics for all permanent job vacancies requiring process or methodology skills in London.

Permanent vacancies with a requirement for process or methodology skills 12,300 21,691 30,657
As % of all permanent jobs advertised in London 96.24% 90.27% 95.26%
Number of salaries quoted 6,989 15,892 22,392
10th Percentile £41,750 £37,500 £42,750
25th Percentile £55,500 £51,250 £55,000
Median annual salary (50th Percentile) £75,000 £70,000 £75,000
Median % change year-on-year +7.14% -6.67% +7.14%
75th Percentile £100,000 £95,000 £95,000
90th Percentile £123,750 £115,000 £116,250
England median annual salary £57,500 £55,000 £62,500
% change year-on-year +4.55% -12.00% +4.17%

SDLC
Job Vacancy Trend in London

Job postings citing SDLC as a proportion of all IT jobs advertised in London.
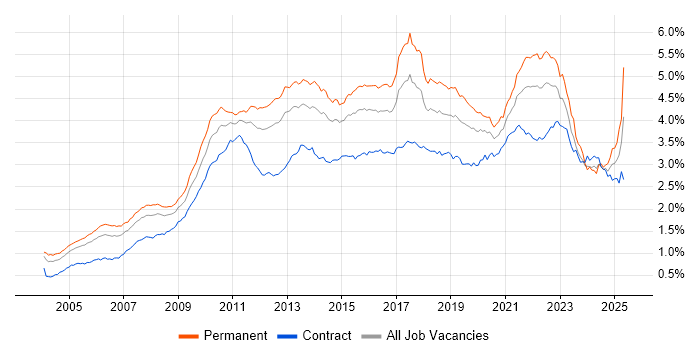
Job vacancy trend for SDLC in London

SDLC
Salary Trend in London

3-month moving average salary quoted in jobs citing SDLC in London.

Salary trend for SDLC in London

SDLC
Salary Histogram in London

Salary distribution for jobs citing SDLC in London over the 6 months to 31 May 2025.

Salary histogram for SDLC in London

SDLC
Job Locations in London

The table below looks at the demand and provides a guide to the median salaries quoted in IT jobs citing SDLC within the London region over the 6 months to 31 May 2025. The 'Rank Change' column provides an indication of the change in demand within each location based on the same 6 month period last year.

Location Rank Change
on Same Period
Last Year
Matching
Permanent
IT Job Ads
Median Salary
Past 6 Months
Median Salary
% Change
on Same Period
Last Year
Live
Jobs
Central London -20 49 £77,500 -7.46% 42
South London -13 5 - - 9
West London +9 1 £87,500 +62.79% 9
SDLC
England

SDLC
Co-occurring Skills and Capabilities in London by Category

The follow tables expand on the table above by listing co-occurrences grouped by category. The same employment type, locality and period is covered with up to 20 co-occurrences shown in each of the following categories:

Application Platforms
1 17 (3.66%) Apache Airflow
2 16 (3.45%) Apache Spark
3 13 (2.80%) CMS
4 9 (1.94%) Drupal
4 9 (1.94%) WordPress
5 7 (1.51%) Apache
6 6 (1.29%) Confluence
6 6 (1.29%) OpenStack
7 5 (1.08%) Liferay
7 5 (1.08%) Microsoft Exchange
8 4 (0.86%) Headless CMS
8 4 (0.86%) Oracle Workflow
9 3 (0.65%) Kinematics
10 2 (0.43%) nginx
10 2 (0.43%) SharePoint
10 2 (0.43%) Tomcat
10 2 (0.43%) Traefik
11 1 (0.22%) WebLogic
11 1 (0.22%) WebSphere
Applications
1 7 (1.51%) Microsoft Office
2 4 (0.86%) Chatbot
2 4 (0.86%) Microsoft Project
3 1 (0.22%) Adobe XD
3 1 (0.22%) Microsoft Excel
3 1 (0.22%) Microsoft PowerPoint
3 1 (0.22%) MS Visio
Business Applications
1 11 (2.37%) Dynamics CRM
2 7 (1.51%) Endur
3 4 (0.86%) Remedy ITSM
3 4 (0.86%) Shopify
4 2 (0.43%) Refinitiv Enterprise Platform
4 2 (0.43%) SimCorp Dimension
5 1 (0.22%) Dynamics NAV
5 1 (0.22%) Oracle EBS
5 1 (0.22%) Oracle EBS R12
5 1 (0.22%) Siebel CRM
Cloud Services
1 142 (30.60%) AWS
2 107 (23.06%) Azure
3 37 (7.97%) Serverless
4 36 (7.76%) GCP
5 31 (6.68%) Amazon S3
6 30 (6.47%) Azure DevOps
7 27 (5.82%) Amazon EKS
8 23 (4.96%) Cloud Computing
9 21 (4.53%) Amazon EC2
10 18 (3.88%) Power Platform
11 17 (3.66%) SaaS
12 16 (3.45%) AWS Lambda
12 16 (3.45%) Datadog
12 16 (3.45%) GitHub
12 16 (3.45%) Power Automate
12 16 (3.45%) PowerApps
13 14 (3.02%) Dynamics 365
14 13 (2.80%) Snowflake
15 10 (2.16%) PaaS
16 9 (1.94%) Azure Sentinel
Communications & Networking
1 14 (3.02%) Network Security
2 12 (2.59%) HTTP
3 9 (1.94%) Firewall
4 8 (1.72%) Multicast
4 8 (1.72%) VPN
5 5 (1.08%) TCP/IP
6 4 (0.86%) DNS
7 2 (0.43%) 4G
7 2 (0.43%) DHCP
7 2 (0.43%) ICMP
7 2 (0.43%) Reverse Proxy
7 2 (0.43%) SAN
7 2 (0.43%) SSL
8 1 (0.22%) NAS
8 1 (0.22%) SSH
8 1 (0.22%) VoIP
Database & Business Intelligence
1 42 (9.05%) SQL Server
2 40 (8.62%) NoSQL
3 32 (6.90%) Relational Database
4 15 (3.23%) PostgreSQL
5 14 (3.02%) Data Warehouse
6 10 (2.16%) Amazon Redshift
6 10 (2.16%) Apache Hive
6 10 (2.16%) Data Lake
6 10 (2.16%) Redis
7 8 (1.72%) MongoDB
7 8 (1.72%) MySQL
8 7 (1.51%) Amazon Athena
8 7 (1.51%) Big Data
8 7 (1.51%) KDB
9 6 (1.29%) BigQuery
9 6 (1.29%) Data Vault
9 6 (1.29%) Hadoop
9 6 (1.29%) RDBMS
9 6 (1.29%) Semantic Layer
9 6 (1.29%) SQL Server Reporting Services
Development Applications
1 59 (12.72%) Git
2 51 (10.99%) JIRA
3 46 (9.91%) Jenkins
4 26 (5.60%) JUnit
5 20 (4.31%) Cucumber
5 20 (4.31%) Maven
6 19 (4.09%) Mockito
7 17 (3.66%) GitLab
8 14 (3.02%) IntelliJ
8 14 (3.02%) Postman
9 13 (2.80%) Selenium
10 11 (2.37%) PowerBuilder
11 10 (2.16%) Cypress.io
11 10 (2.16%) SoapUI
12 8 (1.72%) JMeter
13 7 (1.51%) Vite
14 6 (1.29%) CircleCI
14 6 (1.29%) Mocha
15 4 (0.86%) Atlassian Bamboo
15 4 (0.86%) Subversion
General
1 257 (55.39%) Finance
2 152 (32.76%) Inclusion and Diversity
3 151 (32.54%) Law
4 137 (29.53%) Banking
5 117 (25.22%) Social Skills
6 56 (12.07%) Analytical Skills
7 45 (9.70%) Marketing
8 27 (5.82%) Investment Banking
9 19 (4.09%) Front Office
9 19 (4.09%) Legal
9 19 (4.09%) Public Sector
10 18 (3.88%) Games
11 16 (3.45%) Retail
12 7 (1.51%) Retail Banking
12 7 (1.51%) Telecoms
13 6 (1.29%) Financial Institution
14 5 (1.08%) Organisational Skills
15 4 (0.86%) Documentation Skills
15 4 (0.86%) Manufacturing
15 4 (0.86%) Presentation Skills
Job Titles
1 136 (29.31%) Software Engineer
2 117 (25.22%) Senior
3 108 (23.28%) Lead
4 92 (19.83%) Developer
5 65 (14.01%) Lead Software Engineer
6 48 (10.34%) Senior Software Engineer
7 40 (8.62%) Senior Developer
8 36 (7.76%) Java Engineer
9 34 (7.33%) Java Software Engineer
10 30 (6.47%) Python Engineer
10 30 (6.47%) Python Software Engineer
11 25 (5.39%) Java Developer
12 19 (4.09%) Lead Developer
13 18 (3.88%) Full-Stack Developer
13 18 (3.88%) Senior DevOps
14 17 (3.66%) Analyst
14 17 (3.66%) Architect
15 16 (3.45%) AWS Developer
15 16 (3.45%) AWS DevOps
15 16 (3.45%) Lead Java Engineer
Libraries, Frameworks & Software Standards
1 72 (15.52%) React
2 59 (12.72%) .NET
3 58 (12.50%) Spring
4 47 (10.13%) Kafka
5 41 (8.84%) REST
6 38 (8.19%) Spring Boot
7 31 (6.68%) CSS
7 31 (6.68%) RESTful
8 28 (6.03%) HTML
9 25 (5.39%) GraphQL
10 23 (4.96%) Web Services
11 20 (4.31%) SOAP
12 17 (3.66%) AngularJS
12 17 (3.66%) JMS
12 17 (3.66%) Node.js
13 16 (3.45%) FIX Protocol
14 15 (3.23%) ASP.NET
15 14 (3.02%) ActiveMQ
16 13 (2.80%) Django
16 13 (2.80%) Jest
Miscellaneous
1 80 (17.24%) Cloud Native
2 53 (11.42%) Algorithms
3 43 (9.27%) Management Information System
4 41 (8.84%) Distributed Systems
5 32 (6.90%) Product Ownership
6 25 (5.39%) Mobile App
7 23 (4.96%) Enterprise Software
8 21 (4.53%) Public Cloud
9 20 (4.31%) Reinsurance
10 19 (4.09%) Derivative
11 17 (3.66%) Data Structures
12 15 (3.23%) Equities
13 14 (3.02%) Credit Derivative
13 14 (3.02%) Greenfield Project
13 14 (3.02%) Security Posture
14 13 (2.80%) Client/Server
15 12 (2.59%) Analytical Mindset
15 12 (2.59%) Self-Motivation
16 11 (2.37%) Mobile Banking
17 10 (2.16%) Distributed Applications
Operating Systems
1 50 (10.78%) Linux
2 18 (3.88%) Unix
2 18 (3.88%) Windows
3 5 (1.08%) Android
3 5 (1.08%) Windows Server
4 3 (0.65%) Apple iOS
4 3 (0.65%) Red Hat Enterprise Linux
4 3 (0.65%) Robot Operating System
5 2 (0.43%) Windows Vista
6 1 (0.22%) Debian
6 1 (0.22%) Mac OS
6 1 (0.22%) Ubuntu
Processes & Methodologies
1 274 (59.05%) Agile
2 197 (42.46%) Software Engineering
3 179 (38.58%) CI/CD
4 124 (26.72%) Problem-Solving
5 107 (23.06%) DevOps
6 91 (19.61%) Artificial Intelligence
7 90 (19.40%) Microservices
8 80 (17.24%) Test Automation
9 79 (17.03%) Continuous Improvement
10 77 (16.59%) Computer Science
11 74 (15.95%) Operational Stability
12 64 (13.79%) Analytics
13 58 (12.50%) Community of Practice
14 56 (12.07%) Machine Learning
15 52 (11.21%) Roadmaps
16 50 (10.78%) Mentoring
16 50 (10.78%) Project Management
17 46 (9.91%) Fintech
18 44 (9.48%) Continuous Delivery
19 43 (9.27%) Architectural Design
Programming Languages
1 177 (38.15%) Python
2 167 (35.99%) Java
3 95 (20.47%) SQL
4 73 (15.73%) JavaScript
5 45 (9.70%) C++
6 40 (8.62%) C#
7 36 (7.76%) TypeScript
8 34 (7.33%) Go
9 22 (4.74%) Kotlin
10 21 (4.53%) PowerShell
11 13 (2.80%) Scala
12 12 (2.59%) Shell Script
13 11 (2.37%) C
14 10 (2.16%) Bash
15 6 (1.29%) Groovy
15 6 (1.29%) Rust
16 5 (1.08%) PHP
17 4 (0.86%) Lua
17 4 (0.86%) VB
18 3 (0.65%) R
Qualifications
1 99 (21.34%) Degree
2 30 (6.47%) Computer Science Degree
3 25 (5.39%) Master's Degree
4 15 (3.23%) Azure Certification
5 13 (2.80%) Security Cleared
6 11 (2.37%) PhD
6 11 (2.37%) SC Cleared
7 10 (2.16%) AWS Certification
7 10 (2.16%) CISSP
8 8 (1.72%) Microsoft Certification
9 7 (1.51%) ISTQB
9 7 (1.51%) PMI Certification
10 5 (1.08%) CCSP
10 5 (1.08%) CISA
10 5 (1.08%) Cisco Certification
11 4 (0.86%) (ISC)2 CCSP
11 4 (0.86%) DV Cleared
11 4 (0.86%) ISTQB Foundation Certification
11 4 (0.86%) PMP
12 3 (0.65%) AWS Certified Solutions Architect
Quality Assurance & Compliance
1 38 (8.19%) QA
2 24 (5.17%) ISO/IEC 27001
3 23 (4.96%) GDPR
4 22 (4.74%) NIST
5 13 (2.80%) HIPAA
5 13 (2.80%) SOC 2
6 8 (1.72%) Accessibility
7 6 (1.29%) NCSC
7 6 (1.29%) Software Quality Assurance
8 4 (0.86%) PCI DSS
9 3 (0.65%) Data Quality
10 2 (0.43%) COBIT
10 2 (0.43%) Cyber Essentials
10 2 (0.43%) GRC
10 2 (0.43%) ISO/IEC 27002 (supersedes ISO/IEC 17799)
10 2 (0.43%) PMO
10 2 (0.43%) WCAG
11 1 (0.22%) Cyber Essentials PLUS
System Software
1 67 (14.44%) Docker
2 8 (1.72%) Virtual Machines
3 6 (1.29%) Active Directory
4 5 (1.08%) Apache Flume
5 3 (0.65%) VMware ESXi
5 3 (0.65%) vSphere
6 2 (0.43%) KVM
6 2 (0.43%) VMware Infrastructure
6 2 (0.43%) Xen
7 1 (0.22%) HDFS
Systems Management
1 89 (19.18%) Kubernetes
2 71 (15.30%) Terraform
3 25 (5.39%) Ansible
4 14 (3.02%) Grafana
5 13 (2.80%) Prometheus
6 6 (1.29%) Mesos
6 6 (1.29%) Progress Chef
7 5 (1.08%) HP Fortify
7 5 (1.08%) Oozie
7 5 (1.08%) Puppet
8 3 (0.65%) HP Quality Center
8 3 (0.65%) Single Sign-On
9 2 (0.43%) Argo
9 2 (0.43%) CFEngine
9 2 (0.43%) HAProxy
10 1 (0.22%) Microsoft Intune
Vendors
1 64 (13.79%) Microsoft
2 23 (4.96%) IBM
3 22 (4.74%) Oracle
4 20 (4.31%) Google
5 10 (2.16%) Salesforce
6 9 (1.94%) Databricks
6 9 (1.94%) ServiceNow
7 7 (1.51%) OpenLink
8 6 (1.29%) Alibaba
8 6 (1.29%) SAP
8 6 (1.29%) Splunk
8 6 (1.29%) Sybase
9 5 (1.08%) Cloudera
9 5 (1.08%) OpenAI
9 5 (1.08%) Tanium
10 4 (0.86%) Dynatrace
10 4 (0.86%) MKS
10 4 (0.86%) MuleSoft
10 4 (0.86%) Remedy
10 4 (0.86%) TIBCO