Continuous Improvement Jobs in London

Continual Improvement
England > London

The table below provides summary statistics for permanent job vacancies advertised in London requiring Continuous Improvement skills. It includes a benchmarking guide to the annual salaries offered in vacancies that cited Continuous Improvement over the 6 months leading up to 26 July 2024, comparing them to the same period in the previous two years.

6 months to
26 Jul 2024
Same period 2023 Same period 2022
Rank 56 66 72
Rank change year-on-year +10 +6 +1
Permanent jobs citing Continuous Improvement 961 1,166 4,112
As % of all permanent jobs advertised in London 4.63% 4.30% 5.48%
As % of the Processes & Methodologies category 5.18% 4.54% 5.65%
Number of salaries quoted 627 778 1,628
10th Percentile £42,500 £39,748 £41,000
25th Percentile £59,000 £54,988 £52,500
Median annual salary (50th Percentile) £75,000 £70,250 £67,500
Median % change year-on-year +6.76% +4.07% +3.85%
75th Percentile £97,500 £94,504 £85,000
90th Percentile £117,500 £112,500 £100,000
England median annual salary £60,000 £59,526 £60,000
% change year-on-year +0.80% -0.79% +5.26%

All Process and Methodology Skills
London

Continuous Improvement falls under the Processes and Methodologies category. For comparison with the information above, the following table provides summary statistics for all permanent job vacancies requiring process or methodology skills in London.

Permanent vacancies with a requirement for process or methodology skills 18,545 25,706 72,795
As % of all permanent jobs advertised in London 89.42% 94.78% 97.04%
Number of salaries quoted 12,808 20,124 35,328
10th Percentile £39,500 £42,500 £42,500
25th Percentile £52,500 £55,000 £53,750
Median annual salary (50th Percentile) £72,500 £74,000 £70,000
Median % change year-on-year -2.03% +5.71% -
75th Percentile £95,000 £95,000 £91,732
90th Percentile £120,000 £116,250 £110,000
England median annual salary £55,000 £62,000 £60,000
% change year-on-year -11.29% +3.33% +4.35%

Continuous Improvement
Job Vacancy Trend in London

Job postings citing Continuous Improvement as a proportion of all IT jobs advertised in London.

Job vacancy trend for Continuous Improvement in London

Continuous Improvement
Salary Trend in London

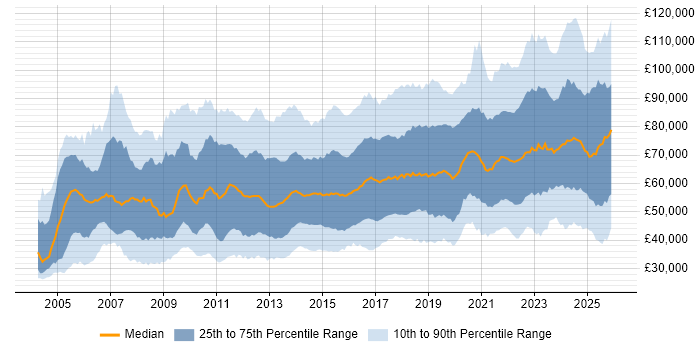
3-month moving average salary quoted in jobs citing Continuous Improvement in London.

Salary trend for Continuous Improvement in London

Continuous Improvement
Salary Histogram in London

Salary distribution for jobs citing Continuous Improvement in London over the 6 months to 26 July 2024.

Salary histogram for Continuous Improvement in London

Continuous Improvement
Job Locations in London

The table below looks at the demand and provides a guide to the median salaries quoted in IT jobs citing Continuous Improvement within the London region over the 6 months to 26 July 2024. The 'Rank Change' column provides an indication of the change in demand within each location based on the same 6 month period last year.

Location Rank Change
on Same Period
Last Year
Matching
Permanent
IT Job Ads
Median Salary
Past 6 Months
Median Salary
% Change
on Same Period
Last Year
Live
Jobs
Central London +41 204 £75,000 -3.23% 52
South London -18 17 £70,000 +64.71% 6
East London +20 13 £67,500 -15.63% 19
West London -54 13 £55,000 +42.86% 32
North London +2 1 £45,000 -29.96% 4
Continuous Improvement
England

Continuous Improvement
Co-occurring Skills and Capabilities in London by Category

The follow tables expand on the table above by listing co-occurrences grouped by category. The same employment type, locality and period is covered with up to 20 co-occurrences shown in each of the following categories:

Application Platforms
1 21 (2.19%) SharePoint
2 18 (1.87%) Microsoft Exchange
3 15 (1.56%) Confluence
4 9 (0.94%) CMS
5 7 (0.73%) Drupal
5 7 (0.73%) SAS
6 6 (0.62%) nginx
7 5 (0.52%) Apache Spark
7 5 (0.52%) Cloud Foundry
8 4 (0.42%) Apache
9 2 (0.21%) Apache Airflow
9 2 (0.21%) Ethereum
9 2 (0.21%) WordPress
10 1 (0.10%) Apache Pulsar
10 1 (0.10%) Camunda
10 1 (0.10%) IIS
10 1 (0.10%) Moodle
Applications
1 56 (5.83%) Microsoft Excel
2 40 (4.16%) Microsoft Office
3 13 (1.35%) Microsoft Project
4 7 (0.73%) MS Visio
5 6 (0.62%) Microsoft PowerPoint
6 4 (0.42%) SPSS
7 3 (0.31%) Adobe After Effects
8 2 (0.21%) Adobe Premiere
8 2 (0.21%) Camtasia
8 2 (0.21%) Photoshop
9 1 (0.10%) Adobe Creative Suite
9 1 (0.10%) Adobe XD
9 1 (0.10%) AutoCAD
9 1 (0.10%) EPLAN
9 1 (0.10%) Notion
9 1 (0.10%) Sketch
9 1 (0.10%) Stata
Business Applications
1 15 (1.56%) Ripple
2 13 (1.35%) Dynamics CRM
2 13 (1.35%) Remedy ITSM
3 11 (1.14%) SAP S/4HANA
4 4 (0.42%) Endur
4 4 (0.42%) Lawson
5 2 (0.21%) NetSuite
5 2 (0.21%) SAP ERP
5 2 (0.21%) Sparx Enterprise Architect
6 1 (0.10%) Adobe Campaign
6 1 (0.10%) Data Workbench
6 1 (0.10%) Dynamics NAV
6 1 (0.10%) SAP Business One
6 1 (0.10%) SAP CRM
6 1 (0.10%) SAP CX
6 1 (0.10%) SAP MDG
6 1 (0.10%) Towers Watson Igloo
6 1 (0.10%) Workday HCM
Cloud Services
1 243 (25.29%) Azure
2 155 (16.13%) AWS
3 96 (9.99%) Power Platform
4 65 (6.76%) Microsoft 365
5 61 (6.35%) GCP
6 58 (6.04%) Azure DevOps
7 47 (4.89%) SaaS
8 40 (4.16%) Entra ID
9 37 (3.85%) Cloud Computing
10 33 (3.43%) Dynamics 365
11 28 (2.91%) Azure Synapse Analytics
12 25 (2.60%) Azure Monitor
13 24 (2.50%) PaaS
13 24 (2.50%) Power Automate
13 24 (2.50%) PowerApps
14 22 (2.29%) Azure Cosmos DB
15 17 (1.77%) Azure Service Bus
16 15 (1.56%) Azure Data Factory
16 15 (1.56%) Serverless
17 14 (1.46%) Azure Storage
Communications & Networking
1 27 (2.81%) Network Security
2 23 (2.39%) Firewall
3 15 (1.56%) VPN
4 14 (1.46%) TCP/IP
5 12 (1.25%) BGP
5 12 (1.25%) MPLS
6 11 (1.14%) Ethernet VPN
7 10 (1.04%) LAN
8 9 (0.94%) DNS
8 9 (0.94%) Internet
8 9 (0.94%) WAN
9 8 (0.83%) SSL
10 7 (0.73%) Cisco ASA
10 7 (0.73%) SD-WAN
10 7 (0.73%) Wireless
11 6 (0.62%) 5G
11 6 (0.62%) Cisco Firepower
11 6 (0.62%) Cisco ISE
11 6 (0.62%) NAS
11 6 (0.62%) Wireshark
Database & Business Intelligence
1 69 (7.18%) Power BI
2 58 (6.04%) SQL Server
3 34 (3.54%) NoSQL
4 31 (3.23%) MongoDB
5 30 (3.12%) Data Warehouse
5 30 (3.12%) Relational Database
6 28 (2.91%) Data Lake
7 20 (2.08%) Tableau
8 16 (1.66%) SQL Server Analysis Services
9 14 (1.46%) Big Data
9 14 (1.46%) MySQL
10 12 (1.25%) PostgreSQL
11 11 (1.14%) MS Access
12 9 (0.94%) Amazon QuickSight
12 9 (0.94%) Data Mining
13 8 (0.83%) SAP BW
13 8 (0.83%) Spotfire
13 8 (0.83%) SQL Server Integration Services
14 7 (0.73%) Azure SQL Database
14 7 (0.73%) SAP HANA
Development Applications
1 65 (6.76%) Git
2 59 (6.14%) JIRA
3 37 (3.85%) Jenkins
4 23 (2.39%) GitLab
5 18 (1.87%) TeamCity
6 15 (1.56%) Artifactory
7 14 (1.46%) Selenium
8 9 (0.94%) Mocha
9 6 (0.62%) RStudio
9 6 (0.62%) webpack
10 5 (0.52%) Cypress.io
10 5 (0.52%) NUnit
10 5 (0.52%) SpecFlow
11 4 (0.42%) CircleCI
11 4 (0.42%) Cucumber
11 4 (0.42%) Grunt
11 4 (0.42%) Jasmine
11 4 (0.42%) Octopus Deploy
11 4 (0.42%) Visual Studio
12 3 (0.31%) ScalaTest
General
1 430 (44.75%) Social Skills
2 316 (32.88%) Finance
3 221 (23.00%) Analytical Skills
4 102 (10.61%) Inclusion and Diversity
5 68 (7.08%) Law
6 67 (6.97%) Legal
7 65 (6.76%) Banking
8 59 (6.14%) Marketing
9 45 (4.68%) Public Sector
10 42 (4.37%) Presentation Skills
11 39 (4.06%) Retail
12 33 (3.43%) Organisational Skills
13 26 (2.71%) Back Office
14 25 (2.60%) Financial Institution
14 25 (2.60%) Manufacturing
15 24 (2.50%) Influencing Skills
16 21 (2.19%) Pharmaceutical
17 17 (1.77%) Local Government
18 15 (1.56%) Telecoms
19 12 (1.25%) Publishing
Job Titles
1 213 (22.16%) Senior
2 120 (12.49%) Lead
3 97 (10.09%) Developer
4 95 (9.89%) Analyst
5 59 (6.14%) Architect
6 46 (4.79%) Senior Manager
7 42 (4.37%) Project Manager
8 30 (3.12%) Senior Developer
9 28 (2.91%) Delivery Manager
9 28 (2.91%) Senior Analyst
10 26 (2.71%) Audit Manager
10 26 (2.71%) Data Engineer
11 25 (2.60%) Infrastructure Manager
12 23 (2.39%) Azure Engineer
12 23 (2.39%) IT Manager
13 22 (2.29%) Cloud Engineer
14 21 (2.19%) Consultant
14 21 (2.19%) Software Engineer
15 20 (2.08%) Quality Manager
16 19 (1.98%) Infrastructure Engineer
Libraries, Frameworks & Software Standards
1 69 (7.18%) .NET
2 41 (4.27%) Kafka
3 39 (4.06%) React
4 33 (3.43%) CSS
4 33 (3.43%) HTML
5 29 (3.02%) XML
6 27 (2.81%) AngularJS
7 25 (2.60%) REST
8 21 (2.19%) PySpark
8 21 (2.19%) RESTful
9 20 (2.08%) .NET Core
9 20 (2.08%) ARM Templates
10 19 (1.98%) YAML
11 17 (1.77%) RabbitMQ
12 15 (1.56%) JSON
13 14 (1.46%) Node.js
14 12 (1.25%) .NET Framework
14 12 (1.25%) ASP.NET
14 12 (1.25%) NETCONF
14 12 (1.25%) Web Services
Miscellaneous
1 65 (6.76%) Onboarding
2 55 (5.72%) Product Ownership
3 51 (5.31%) Management Information System
4 43 (4.47%) Public Cloud
5 42 (4.37%) Cloud Native
6 37 (3.85%) Self-Motivation
7 26 (2.71%) Clustering
8 22 (2.29%) Life Science
9 21 (2.19%) Linux Command Line
10 19 (1.98%) Blockchain
11 18 (1.87%) Robotics
11 18 (1.87%) Virtual Team
12 17 (1.77%) Data Centre
13 15 (1.56%) Algorithms
13 15 (1.56%) Hybrid Cloud
14 14 (1.46%) Analytical Mindset
14 14 (1.46%) Enterprise Software
15 13 (1.35%) Greenfield Project
15 13 (1.35%) Replication
16 12 (1.25%) CMDB
Operating Systems
1 97 (10.09%) Windows
2 74 (7.70%) Linux
3 44 (4.58%) Windows Server
4 27 (2.81%) Unix
5 19 (1.98%) Windows 10
6 14 (1.46%) Red Hat Enterprise Linux
7 12 (1.25%) Oracle Linux
8 11 (1.14%) CentOS
9 10 (1.04%) Solaris
9 10 (1.04%) Windows Server 2016
10 9 (0.94%) Mac OS
11 5 (0.52%) Apple iOS
12 4 (0.42%) Android
13 3 (0.31%) VMS
13 3 (0.31%) Windows Server 2019
14 2 (0.21%) AIX
14 2 (0.21%) Windows Server 2012
15 1 (0.10%) SUSE
15 1 (0.10%) Ubuntu
15 1 (0.10%) Windows 7
Processes & Methodologies
1 339 (35.28%) Agile
2 307 (31.95%) Problem-Solving
3 171 (17.79%) DevOps
4 151 (15.71%) Project Management
5 132 (13.74%) Mentoring
6 128 (13.32%) Analytics
7 121 (12.59%) CI/CD
8 114 (11.86%) Roadmaps
9 101 (10.51%) Decision-Making
10 100 (10.41%) Risk Management
11 89 (9.26%) Scrum
12 88 (9.16%) Software Engineering
13 80 (8.32%) Stakeholder Management
14 76 (7.91%) Computer Science
14 76 (7.91%) Project Delivery
15 75 (7.80%) Technical Leadership
16 74 (7.70%) Change Management
17 73 (7.60%) Coaching
18 70 (7.28%) Information Security
19 67 (6.97%) Migration
Programming Languages
1 160 (16.65%) SQL
2 144 (14.98%) Python
3 80 (8.32%) C#
3 80 (8.32%) Java
4 65 (6.76%) PowerShell
5 40 (4.16%) Bash
6 39 (4.06%) JavaScript
7 24 (2.50%) TypeScript
8 15 (1.56%) Bicep
9 12 (1.25%) Kotlin
9 12 (1.25%) Scala
10 10 (1.04%) C++
10 10 (1.04%) VBA
11 8 (0.83%) T-SQL
12 7 (0.73%) Data Analysis Expressions
12 7 (0.73%) Go
12 7 (0.73%) PHP
13 6 (0.62%) R
13 6 (0.62%) Ruby
14 4 (0.42%) Perl
Qualifications
1 217 (22.58%) Degree
2 62 (6.45%) Master's Degree
3 54 (5.62%) Computer Science Degree
4 47 (4.89%) Security Cleared
5 35 (3.64%) Azure Certification
6 29 (3.02%) CISSP
7 27 (2.81%) SC Cleared
8 26 (2.71%) Cisco Certification
9 24 (2.50%) CCNP
10 21 (2.19%) PMI Certification
11 20 (2.08%) CISA
12 19 (1.98%) AWS Certification
13 18 (1.87%) CRISC
14 17 (1.77%) CCNA
14 17 (1.77%) PMP
15 15 (1.56%) CEH
16 14 (1.46%) ACCA
17 13 (1.35%) ITIL Certification
18 12 (1.25%) CISM
18 12 (1.25%) MBA
Quality Assurance & Compliance
1 99 (10.30%) QA
2 35 (3.64%) Data Quality
3 24 (2.50%) Good Clinical Practice
4 23 (2.39%) Accessibility
5 21 (2.19%) NIST
6 18 (1.87%) IFRS
7 17 (1.77%) ISO/IEC 27001
8 16 (1.66%) GDPR
9 13 (1.35%) COBIT
9 13 (1.35%) PMO
10 9 (0.94%) GLP
11 7 (0.73%) Sarbanes-Oxley
11 7 (0.73%) SLA
12 6 (0.62%) Cyber Essentials
12 6 (0.62%) HIPAA
12 6 (0.62%) PCI DSS
13 5 (0.52%) GRC
14 4 (0.42%) FISMA
14 4 (0.42%) GLBA
15 3 (0.31%) ISO/IEC 17025
System Software
1 78 (8.12%) Docker
2 66 (6.87%) Active Directory
3 20 (2.08%) VMware Infrastructure
4 15 (1.56%) VMware ESXi
5 6 (0.62%) VMware NSX
6 5 (0.52%) NFS
7 4 (0.42%) Hyper-V
8 3 (0.31%) Virtual Machines
8 3 (0.31%) vSphere
9 2 (0.21%) Ceph
9 2 (0.21%) HDFS
9 2 (0.21%) IAG
10 1 (0.10%) Firmware
10 1 (0.10%) vCloud
Systems Management
1 94 (9.78%) Kubernetes
2 49 (5.10%) Terraform
3 31 (3.23%) Ansible
4 26 (2.71%) Microsoft Intune
5 25 (2.60%) Grafana
6 19 (1.98%) Prometheus
7 15 (1.56%) vCenter Server
8 14 (1.46%) Single Sign-On
9 13 (1.35%) Microsoft Clustering
10 10 (1.04%) SCCM
11 7 (0.73%) Kibana
12 5 (0.52%) Functional Safety
12 5 (0.52%) Jamf Pro
12 5 (0.52%) Puppet
13 4 (0.42%) CASB
13 4 (0.42%) Istio
13 4 (0.42%) Progress Chef
14 2 (0.21%) cPanel
14 2 (0.21%) Nagios
14 2 (0.21%) Salt
Vendors
1 185 (19.25%) Microsoft
2 45 (4.68%) Cisco
3 40 (4.16%) VMware
4 35 (3.64%) Databricks
5 32 (3.33%) Oracle
6 26 (2.71%) SAP
7 24 (2.50%) ServiceNow
8 18 (1.87%) Remedy
9 15 (1.56%) Commvault
10 14 (1.46%) Google
10 14 (1.46%) Sun
11 13 (1.35%) HP
11 13 (1.35%) Salesforce
12 12 (1.25%) BMC
12 12 (1.25%) Serena
12 12 (1.25%) Splunk
13 11 (1.14%) Citrix
14 10 (1.04%) Juniper
14 10 (1.04%) Palo Alto
14 10 (1.04%) Red Hat