Project Management Jobs in London

Project Management
England > London

The following table provides summary statistics for permanent job vacancies advertised in London with a requirement for Project Management skills. Included is a benchmarking guide to the salaries offered in vacancies that have cited Project Management over the 6 months to 1 December 2023 with a comparison to the same period in the previous 2 years.

6 months to
1 Dec 2023
Same period 2022 Same period 2021
Rank 31 35 48
Rank change year-on-year +4 +13 +10
Permanent jobs citing Project Management 1,334 3,471 3,394
As % of all permanent jobs advertised in London 7.13% 7.25% 6.56%
As % of the Processes & Methodologies category 7.62% 7.57% 6.82%
Number of salaries quoted 998 2,383 2,381
10th Percentile £44,675 £43,750 £42,000
25th Percentile £55,000 £52,500 £51,250
Median annual salary (50th Percentile) £67,500 £67,500 £65,000
Median % change year-on-year - +3.85% -
75th Percentile £82,500 £85,000 £81,250
90th Percentile £97,500 £98,500 £95,000
England median annual salary £60,000 £59,500 £55,000
% change year-on-year +0.84% +8.18% -

All Process and Methodology Skills
London

Project Management is in the Processes and Methodologies category. The following table is for comparison with the above and provides summary statistics for all permanent job vacancies advertised in London with a requirement for process or methodology skills.

Permanent vacancies with a requirement for process or methodology skills 17,505 45,859 49,743
As % of all permanent jobs advertised in London 93.56% 95.77% 96.15%
Number of salaries quoted 14,030 31,132 33,332
10th Percentile £42,000 £42,500 £42,250
25th Percentile £56,250 £55,000 £53,000
Median annual salary (50th Percentile) £75,000 £72,500 £70,000
Median % change year-on-year +3.45% +3.57% -
75th Percentile £95,000 £93,750 £90,000
90th Percentile £116,250 £112,500 £108,750
England median annual salary £60,000 £62,500 £60,000
% change year-on-year -4.00% +4.17% +9.09%

Project Management
Job Vacancy Trend in London

Job postings citing Project Management as a proportion of all IT jobs advertised in London.
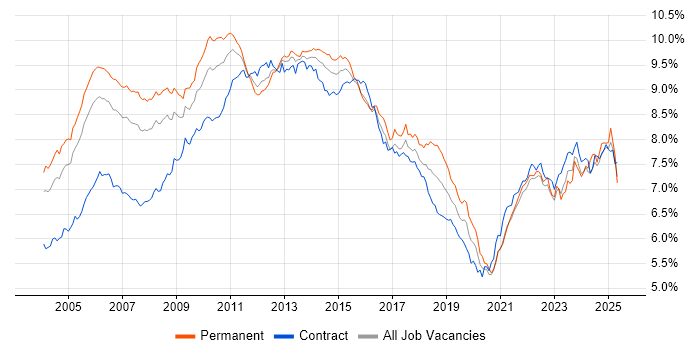
Job vacancy trend for Project Management in London

Project Management
Salary Trend in London

3-month moving average salary quoted in jobs citing Project Management in London.

Salary trend for Project Management in London

Project Management
Salary Histogram in London

Salary distribution for jobs citing Project Management in London over the 6 months to 1 December 2023.

Salary histogram for Project Management in London

Project Management
Job Locations in London

The table below looks at the demand and provides a guide to the median salaries quoted in IT jobs citing Project Management within the London region over the 6 months to 1 December 2023. The 'Rank Change' column provides an indication of the change in demand within each location based on the same 6 month period last year.

Location Rank Change
on Same Period
Last Year
Matching
Permanent
IT Job Ads
Median Salary
Past 6 Months
Median Salary
% Change
on Same Period
Last Year
Live
Jobs
Central London +16 237 £66,250 -8.62% 127
West London -2 30 £57,500 +4.55% 84
South London +2 24 £60,000 +14.29% 22
East London -22 13 £55,000 -12.00% 77
North London -5 1 £57,000 -18.57% 7
Project Management
England

Project Management
Co-occurring Skills and Capabilities in London by Category

The follow tables expand on the table above by listing co-occurrences grouped by category. The same employment type, locality and period is covered with up to 20 co-occurrences shown in each of the following categories:

Application Platforms
1 28 (2.10%) Confluence
1 28 (2.10%) SharePoint
2 26 (1.95%) CMS
3 17 (1.27%) Apache Spark
4 7 (0.52%) MS Exchange
4 7 (0.52%) SAS
4 7 (0.52%) WordPress
5 4 (0.30%) IIS
5 4 (0.30%) OpenStack
6 3 (0.22%) Apache
6 3 (0.22%) Exchange Server 2010
7 2 (0.15%) Adobe Experience Manager
7 2 (0.15%) Camunda
7 2 (0.15%) Mendix
7 2 (0.15%) Tomcat
8 1 (0.075%) Apache Airflow
8 1 (0.075%) Appian
8 1 (0.075%) Exchange Server 2013
8 1 (0.075%) Headless CMS
8 1 (0.075%) Moodle
Applications
1 96 (7.20%) Microsoft Office
2 82 (6.15%) Microsoft Excel
3 71 (5.32%) Microsoft Project
4 46 (3.45%) Microsoft PowerPoint
5 29 (2.17%) MS Visio
6 8 (0.60%) AutoCAD
7 3 (0.22%) Oracle Smart View
7 3 (0.22%) Spreadsheet
8 2 (0.15%) Adobe After Effects
8 2 (0.15%) Adobe Creative Suite
8 2 (0.15%) Adobe Premiere
8 2 (0.15%) Adobe XD
8 2 (0.15%) Chatbot
8 2 (0.15%) EViews
8 2 (0.15%) SketchUp
9 1 (0.075%) Adobe Illustrator
9 1 (0.075%) InDesign
9 1 (0.075%) Photoshop
9 1 (0.075%) Sketch
9 1 (0.075%) SOLIDWORKS
Business Applications
1 19 (1.42%) Elite 3E
1 19 (1.42%) Remedy ITSM
2 17 (1.27%) Dynamics CRM
3 15 (1.12%) SAP S/4HANA
4 8 (0.60%) SAP ERP
5 7 (0.52%) HFM
5 7 (0.52%) Shopify
6 6 (0.45%) Salesforce CRM
7 5 (0.37%) Oracle ERP
7 5 (0.37%) Oracle Financials
8 4 (0.30%) Dynamics AX
8 4 (0.30%) Dynamics GP
8 4 (0.30%) Hyperion Planning
8 4 (0.30%) Oracle Payables
9 3 (0.22%) Eloqua
9 3 (0.22%) Oracle AGIS
9 3 (0.22%) Oracle Assets
9 3 (0.22%) Oracle E-Business Tax
9 3 (0.22%) Oracle General Ledger
9 3 (0.22%) Oracle iProcurement
Cloud Services
1 208 (15.59%) Azure
2 103 (7.72%) Microsoft 365
3 88 (6.60%) SaaS
4 81 (6.07%) Power Platform
5 76 (5.70%) AWS
6 50 (3.75%) GCP
7 45 (3.37%) Entra ID
8 31 (2.32%) Azure DevOps
9 28 (2.10%) Dynamics 365
10 27 (2.02%) PowerApps
11 22 (1.65%) Google Analytics
11 22 (1.65%) Power Automate
12 18 (1.35%) PaaS
13 16 (1.20%) IaaS
14 12 (0.90%) Azure Storage
15 10 (0.75%) WhatsApp
16 9 (0.67%) Azure Synapse Analytics
16 9 (0.67%) Cloud Computing
16 9 (0.67%) Contentful
17 8 (0.60%) Snowflake
Communications & Networking
1 49 (3.67%) Firewall
2 44 (3.30%) VPN
3 35 (2.62%) DNS
4 29 (2.17%) DHCP
5 28 (2.10%) LAN
5 28 (2.10%) WAN
6 26 (1.95%) Intranet
7 21 (1.57%) Network Security
7 21 (1.57%) Wi-Fi
7 21 (1.57%) Wireless
8 16 (1.20%) Unified Communications
9 14 (1.05%) TCP/IP
10 12 (0.90%) Internet
10 12 (0.90%) VLAN
11 11 (0.82%) MPLS
12 10 (0.75%) SAN
13 7 (0.52%) SD-WAN
13 7 (0.52%) VoIP
14 6 (0.45%) PBX
15 5 (0.37%) WLAN
Database & Business Intelligence
1 58 (4.35%) Power BI
2 48 (3.60%) SQL Server
3 34 (2.55%) Tableau
4 31 (2.32%) MySQL
5 28 (2.10%) Relational Database
6 24 (1.80%) Hadoop
7 23 (1.72%) Data Mining
8 21 (1.57%) Data Warehouse
9 19 (1.42%) Data Lake
9 19 (1.42%) Elasticsearch
10 17 (1.27%) Apache Ignite
11 12 (0.90%) Metadata
12 10 (0.75%) Big Data
13 9 (0.67%) PostgreSQL
14 8 (0.60%) NoSQL
15 7 (0.52%) BigQuery
16 6 (0.45%) Oracle Reports
17 5 (0.37%) BusinessObjects
17 5 (0.37%) MS Access
18 4 (0.30%) Azure SQL Database
Development Applications
1 70 (5.25%) JIRA
2 16 (1.20%) Jenkins
3 12 (0.90%) Git
4 10 (0.75%) Visual Studio
5 9 (0.67%) Bitbucket
6 5 (0.37%) TestRail
7 4 (0.30%) Subversion
8 3 (0.22%) Maven
9 2 (0.15%) Atlassian Bamboo
9 2 (0.15%) FindBugs
9 2 (0.15%) FishEye
9 2 (0.15%) JIRA Agile
9 2 (0.15%) Log4j
9 2 (0.15%) Mercurial
9 2 (0.15%) Selenium
9 2 (0.15%) SonarQube
9 2 (0.15%) SQL Server Management Studio (SSMS)
9 2 (0.15%) Team Foundation Server
9 2 (0.15%) Vagrant
9 2 (0.15%) Zephyr
General
1 523 (39.21%) Social Skills
2 481 (36.06%) Finance
3 262 (19.64%) Analytical Skills
4 118 (8.85%) Marketing
5 113 (8.47%) Legal
6 104 (7.80%) Retail
7 75 (5.62%) Public Sector
8 73 (5.47%) Banking
9 66 (4.95%) Inclusion and Diversity
9 66 (4.95%) Presentation Skills
10 65 (4.87%) Telecoms
11 56 (4.20%) Organisational Skills
12 39 (2.92%) Manufacturing
13 38 (2.85%) Law
14 32 (2.40%) Influencing Skills
15 30 (2.25%) Back Office
16 24 (1.80%) Publishing
17 23 (1.72%) Advertising
17 23 (1.72%) Automotive
18 22 (1.65%) French Language
Job Titles
1 406 (30.43%) Project Manager
2 209 (15.67%) Senior
3 179 (13.42%) Analyst
4 101 (7.57%) IT Manager
5 92 (6.90%) Senior Manager
6 87 (6.52%) Business Analyst
7 85 (6.37%) Architect
8 82 (6.15%) Lead
9 68 (5.10%) Senior Project Manager
10 66 (4.95%) Consultant
11 57 (4.27%) IT Project Manager
12 55 (4.12%) Infrastructure Manager
13 45 (3.37%) Infrastructure Project Manager
14 41 (3.07%) Solutions Architect
15 38 (2.85%) Software Project Manager
16 35 (2.62%) Developer
16 35 (2.62%) Technical Manager
17 34 (2.55%) Senior Analyst
18 32 (2.40%) IT Analyst
19 29 (2.17%) Senior Architect
Libraries, Frameworks & Software Standards
1 33 (2.47%) Web Services
2 32 (2.40%) XML
3 31 (2.32%) .NET
4 30 (2.25%) HTML
5 28 (2.10%) JSON
6 25 (1.87%) REST
7 21 (1.57%) SOAP
8 20 (1.50%) CSS
9 19 (1.42%) Kafka
10 17 (1.27%) React
11 15 (1.12%) Velocity
12 9 (0.67%) .NET Framework
12 9 (0.67%) ATL
13 8 (0.60%) EDI
14 7 (0.52%) AngularJS
15 6 (0.45%) ADO
15 6 (0.45%) ASP.NET
15 6 (0.45%) Classic ASP
15 6 (0.45%) PySpark
16 5 (0.37%) FHIR
Miscellaneous
1 107 (8.02%) Management Information System
2 51 (3.82%) Onboarding
3 49 (3.67%) Product Ownership
4 37 (2.77%) Self-Motivation
5 32 (2.40%) Virtual Team
6 25 (1.87%) PMI
7 24 (1.80%) Social Media
8 23 (1.72%) FMCG
9 22 (1.65%) Legacy Systems
10 21 (1.57%) Greenfield Project
11 17 (1.27%) Public Cloud
12 12 (0.90%) Reinsurance
13 11 (0.82%) Analytical Mindset
13 11 (0.82%) Foreign Exchange (FX)
14 10 (0.75%) iPad
15 9 (0.67%) Enterprise Software
15 9 (0.67%) NHS
16 8 (0.60%) Data Centre
16 8 (0.60%) Data Structures
16 8 (0.60%) Life Science
Operating Systems
1 131 (9.82%) Windows
2 41 (3.07%) Windows Server
3 24 (1.80%) Linux
4 21 (1.57%) Windows 10
5 16 (1.20%) Apple iOS
6 14 (1.05%) Android
7 13 (0.97%) Windows Server 2016
8 12 (0.90%) Windows Server 2012
9 7 (0.52%) Mac OS
10 6 (0.45%) Unix
11 4 (0.30%) VMS
11 4 (0.30%) Windows Server 2019
12 1 (0.075%) Solaris
12 1 (0.075%) Windows Server 2003
12 1 (0.075%) Windows Server 2008
Processes & Methodologies
1 524 (39.28%) Agile
2 327 (24.51%) Project Delivery
3 275 (20.61%) Problem-Solving
4 236 (17.69%) Stakeholder Management
5 196 (14.69%) PRINCE2
6 179 (13.42%) Waterfall
7 150 (11.24%) Business Analysis
8 149 (11.17%) Mentoring
9 133 (9.97%) Change Management
10 128 (9.60%) Scrum
11 121 (9.07%) Roadmaps
12 119 (8.92%) Decision-Making
13 117 (8.77%) ITIL
14 115 (8.62%) Business Intelligence
15 114 (8.55%) Continuous Improvement
16 110 (8.25%) Analytics
17 98 (7.35%) SDLC
18 93 (6.97%) Coaching
18 93 (6.97%) Process Improvement
19 91 (6.82%) Migration
Programming Languages
1 124 (9.30%) SQL
2 90 (6.75%) Python
3 33 (2.47%) JavaScript
4 29 (2.17%) PowerShell
5 25 (1.87%) Java
6 24 (1.80%) C#
7 22 (1.65%) R
8 20 (1.50%) Perl
9 14 (1.05%) TypeScript
10 10 (0.75%) Bash
11 8 (0.60%) X++
12 4 (0.30%) C++
12 4 (0.30%) MATLAB
12 4 (0.30%) PHP
12 4 (0.30%) PL/SQL
12 4 (0.30%) Ruby
13 3 (0.22%) T-SQL
13 3 (0.22%) VBA
14 2 (0.15%) Groovy
14 2 (0.15%) VB
Qualifications
1 368 (27.59%) Degree
2 99 (7.42%) Security Cleared
3 82 (6.15%) PMI Certification
4 77 (5.77%) PMP
5 56 (4.20%) Master's Degree
6 49 (3.67%) SC Cleared
7 44 (3.30%) Computer Science Degree
8 42 (3.15%) DV Cleared
9 23 (1.72%) PRINCE2 Certification
10 16 (1.20%) Cisco Certification
10 16 (1.20%) PRINCE2 Practitioner
11 12 (0.90%) Azure Certification
12 11 (0.82%) MBA
12 11 (0.82%) Microsoft Certification
13 10 (0.75%) CCNA
14 8 (0.60%) CISSP
15 7 (0.52%) GCIA
16 6 (0.45%) CCNP
16 6 (0.45%) DBS Check
16 6 (0.45%) ITIL Certification
Quality Assurance & Compliance
1 108 (8.10%) PMO
2 105 (7.87%) QA
3 31 (2.32%) Data Quality
4 18 (1.35%) GDPR
5 14 (1.05%) ISO/IEC 27001
6 13 (0.97%) SLA
7 10 (0.75%) Sarbanes-Oxley
8 9 (0.67%) Actionable Recommendations
9 7 (0.52%) ITGC
10 5 (0.37%) Accessibility
10 5 (0.37%) GAAP
10 5 (0.37%) GRC
10 5 (0.37%) HL7
10 5 (0.37%) IFRS
10 5 (0.37%) NIST
11 3 (0.22%) DICOM
11 3 (0.22%) MiFID
12 2 (0.15%) Cyber Essentials
12 2 (0.15%) EMIR
12 2 (0.15%) P3O
System Software
1 84 (6.30%) Active Directory
2 41 (3.07%) VMware Infrastructure
3 15 (1.12%) VMware ESXi
4 12 (0.90%) Docker
5 11 (0.82%) Hyper-V
6 9 (0.67%) Virtual Machines
7 4 (0.30%) Firmware
8 3 (0.22%) Ceph
8 3 (0.22%) KVM
9 2 (0.15%) VMware Server
10 1 (0.075%) Microsoft Virtual Server
10 1 (0.075%) Virtual Desktop
10 1 (0.075%) Virtual Servers
Systems Management
1 31 (2.32%) Microsoft Intune
2 28 (2.10%) SCCM
3 18 (1.35%) Terraform
4 15 (1.12%) Ansible
4 15 (1.12%) Kubernetes
5 7 (0.52%) Single Sign-On
6 5 (0.37%) Packer
7 3 (0.22%) Cisco CUCM
7 3 (0.22%) FortiGate
7 3 (0.22%) Nagios
7 3 (0.22%) NetBackup
7 3 (0.22%) WSUS
8 2 (0.15%) SCOM
8 2 (0.15%) Tivoli Storage Manager
9 1 (0.075%) Grafana
9 1 (0.075%) Jamf Pro
9 1 (0.075%) Nmap
Vendors
1 225 (16.87%) Microsoft
2 70 (5.25%) Oracle
3 64 (4.80%) Google
4 63 (4.72%) SAP
5 53 (3.97%) VMware
6 43 (3.22%) HP
6 43 (3.22%) ServiceNow
7 41 (3.07%) Salesforce
8 39 (2.92%) Dell
9 34 (2.55%) Cisco
10 22 (1.65%) Bloomberg
11 21 (1.57%) Remedy
12 20 (1.50%) BMC
13 13 (0.97%) Atlassian
14 12 (0.90%) iManage
15 10 (0.75%) Citrix
15 10 (0.75%) Workday
16 9 (0.67%) NEC
16 9 (0.67%) Sage
16 9 (0.67%) Veeam