Management Information System Jobs in London

Management Information Systems
England > London

The table below looks at the prevalence of the term Management Information System in permanent job vacancies in London. Included is a benchmarking guide to the salaries offered in vacancies that cited Management Information System over the 6 months leading up to 12 May 2025, comparing them to the same period in the previous two years.

6 months to
12 May 2025
Same period 2024 Same period 2023
Rank 75 90 89
Rank change year-on-year +15 -1 +89
Permanent jobs citing Management Information System 522 768 1,232
As % of all permanent jobs advertised in London 4.04% 3.25% 3.60%
As % of the Miscellaneous category 9.22% 8.04% 7.79%
Number of salaries quoted 223 579 682
10th Percentile £45,850 £36,292 £37,265
25th Percentile £57,670 £43,997 £51,250
Median annual salary (50th Percentile) £72,500 £57,500 £65,000
Median % change year-on-year +26.09% -11.54% -
75th Percentile £88,750 £77,500 £88,750
90th Percentile £120,000 £90,000 £110,000
England median annual salary £57,836 £50,000 £57,500
% change year-on-year +15.67% -13.04% +4.55%

All Generic Skills
London

Management Information System falls under the General and Transferable Skills category. For comparison with the information above, the following table provides summary statistics for all permanent job vacancies requiring generic IT skills in London.

Permanent vacancies with a requirement for generic IT skills 5,664 9,556 15,821
As % of all permanent jobs advertised in London 43.80% 40.43% 46.18%
Number of salaries quoted 3,228 6,785 10,689
10th Percentile £41,875 £37,500 £44,192
25th Percentile £56,250 £51,532 £56,250
Median annual salary (50th Percentile) £80,000 £75,000 £75,000
Median % change year-on-year +6.67% - -
75th Percentile £110,000 £100,000 £100,000
90th Percentile £137,500 £128,750 £122,500
England median annual salary £60,000 £55,000 £65,000
% change year-on-year +9.09% -15.38% +4.00%

Management Information System
Job Vacancy Trend in London

Job postings citing Management Information System as a proportion of all IT jobs advertised in London.
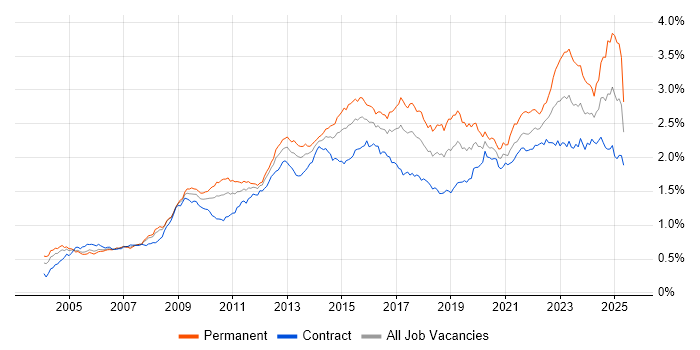
Job vacancy trend for Management Information System in London

Management Information System
Salary Trend in London

3-month moving average salary quoted in jobs citing Management Information System in London.

Salary trend for Management Information System in London

Management Information System
Salary Histogram in London

Salary distribution for jobs citing Management Information System in London over the 6 months to 12 May 2025.

Salary histogram for Management Information System in London

Management Information System
Job Locations in London

The table below looks at the demand and provides a guide to the median salaries quoted in IT jobs citing Management Information System within the London region over the 6 months to 12 May 2025. The 'Rank Change' column provides an indication of the change in demand within each location based on the same 6 month period last year.

Location Rank Change
on Same Period
Last Year
Matching
Permanent
IT Job Ads
Median Salary
Past 6 Months
Median Salary
% Change
on Same Period
Last Year
Live
Jobs
Central London +27 87 £65,000 +34.02% 26
West London +33 16 £67,820 +45.07% 34
South London -1 9 £52,656 +13.85% 25
East London -8 9 £108,750 +61.11% 9
Management Information System
England

Management Information System
Co-occurring Skills and Capabilities in London by Category

The follow tables expand on the table above by listing co-occurrences grouped by category. The same employment type, locality and period is covered with up to 20 co-occurrences shown in each of the following categories:

Application Platforms
1 27 (5.17%) SharePoint
2 24 (4.60%) Microsoft Exchange
3 20 (3.83%) Confluence
4 5 (0.96%) CMS
5 3 (0.57%) nginx
6 2 (0.38%) Skype for Business
6 2 (0.38%) WordPress
7 1 (0.19%) Apache
7 1 (0.19%) IIS
7 1 (0.19%) JBoss
7 1 (0.19%) SharePoint Server
7 1 (0.19%) WebSphere
Applications
1 63 (12.07%) Microsoft Excel
2 42 (8.05%) Microsoft Office
3 20 (3.83%) Microsoft PowerPoint
4 11 (2.11%) MS Visio
5 4 (0.77%) Chatbot
6 3 (0.57%) Trello
7 2 (0.38%) Notion
7 2 (0.38%) SOLIDWORKS
8 1 (0.19%) Camtasia
8 1 (0.19%) Final Cut Pro
8 1 (0.19%) Microsoft Project
8 1 (0.19%) SPSS
Business Applications
1 17 (3.26%) Dynamics AX
2 7 (1.34%) Elite 3E
3 5 (0.96%) Infor SunSystems
4 4 (0.77%) Dynamics CRM
4 4 (0.77%) iTrent
4 4 (0.77%) Remedy ITSM
5 3 (0.57%) Salesforce CRM
6 2 (0.38%) Dynamics NAV
7 1 (0.19%) NEC Housing
7 1 (0.19%) SAP GRC
7 1 (0.19%) SAP S/4HANA
Cloud Services
1 142 (27.20%) Azure
2 128 (24.52%) AWS
3 55 (10.54%) GCP
4 48 (9.20%) Microsoft 365
5 40 (7.66%) Power Platform
6 31 (5.94%) Serverless
7 28 (5.36%) AWS Lambda
8 22 (4.21%) Entra ID
9 21 (4.02%) SaaS
10 19 (3.64%) Amazon EC2
10 19 (3.64%) Power Automate
11 18 (3.45%) Datadog
12 17 (3.26%) Amazon S3
13 15 (2.87%) Cloud Computing
13 15 (2.87%) Dynamics 365
14 14 (2.68%) Amazon EKS
14 14 (2.68%) AWS CloudFormation
14 14 (2.68%) GitHub
15 13 (2.49%) AWS KMS
15 13 (2.49%) PaaS
Communications & Networking
1 79 (15.13%) Firewall
2 54 (10.34%) Network Security
3 18 (3.45%) BGP
4 17 (3.26%) OSPF
4 17 (3.26%) TCP/IP
4 17 (3.26%) VPN
5 15 (2.87%) DHCP
5 15 (2.87%) DNS
6 13 (2.49%) WAN
7 11 (2.11%) LAN
7 11 (2.11%) Wi-Fi
8 10 (1.92%) Cisco ASA
8 10 (1.92%) IPsec
8 10 (1.92%) MPLS
8 10 (1.92%) NX-OS
8 10 (1.92%) SD-WAN
8 10 (1.92%) WLAN
9 9 (1.72%) Internet
10 8 (1.53%) Cisco Firepower
11 7 (1.34%) Spanning Tree
Database & Business Intelligence
1 38 (7.28%) Power BI
2 31 (5.94%) SQL Server
3 22 (4.21%) Data Warehouse
4 12 (2.30%) Metadata
4 12 (2.30%) NoSQL
4 12 (2.30%) Relational Database
5 10 (1.92%) Oracle Reports
6 9 (1.72%) Data Lake
6 9 (1.72%) Tableau
7 8 (1.53%) Tick Data
8 5 (0.96%) Neo4j
8 5 (0.96%) SQL Server Reporting Services
9 4 (0.77%) Data Mining
10 3 (0.57%) Amazon RDS
10 3 (0.57%) Electronic Patient Records
11 2 (0.38%) Azure SQL Data Warehouse
11 2 (0.38%) MySQL
11 2 (0.38%) PostgreSQL
11 2 (0.38%) SQL Server Integration Services
12 1 (0.19%) Data Mart
Development Applications
1 36 (6.90%) Git
2 31 (5.94%) Jenkins
3 25 (4.79%) JIRA
4 15 (2.87%) Maven
5 14 (2.68%) Cucumber
5 14 (2.68%) GitLab
5 14 (2.68%) IntelliJ
5 14 (2.68%) JUnit
5 14 (2.68%) Mockito
6 7 (1.34%) Atlassian Bamboo
7 6 (1.15%) SonarQube
8 5 (0.96%) AppScan
9 3 (0.57%) Babel
9 3 (0.57%) gulp
9 3 (0.57%) PowerBuilder
9 3 (0.57%) webpack
10 1 (0.19%) Ant
10 1 (0.19%) Bitbucket
10 1 (0.19%) Oracle Forms
10 1 (0.19%) Sonatype Nexus
General
1 224 (42.91%) Finance
2 155 (29.69%) Social Skills
3 75 (14.37%) Analytical Skills
4 55 (10.54%) Legal
5 47 (9.00%) Law
6 32 (6.13%) Retail
7 30 (5.75%) Telecoms
8 29 (5.56%) Marketing
9 27 (5.17%) Inclusion and Diversity
10 26 (4.98%) Front Office
11 22 (4.21%) Banking
11 22 (4.21%) Organisational Skills
12 18 (3.45%) Presentation Skills
13 16 (3.07%) Games
14 15 (2.87%) Manufacturing
14 15 (2.87%) Public Sector
15 11 (2.11%) German Language
16 10 (1.92%) Investment Banking
17 9 (1.72%) Influencing Skills
18 7 (1.34%) Aviation
Job Titles
1 96 (18.39%) Senior
2 80 (15.33%) Analyst
3 56 (10.73%) Architect
4 44 (8.43%) Lead
5 43 (8.24%) Developer
6 33 (6.32%) AWS Architect
7 28 (5.36%) Senior Developer
8 26 (4.98%) Python Developer
9 23 (4.41%) Cloud Architect
9 23 (4.41%) Solutions Architect
10 21 (4.02%) Security Manager
11 18 (3.45%) AWS DevOps
12 17 (3.26%) Senior DevOps
13 16 (3.07%) C++ Developer
13 16 (3.07%) Linux Developer
14 15 (2.87%) Data Analyst
14 15 (2.87%) Infrastructure Engineer
14 15 (2.87%) IT Manager
14 15 (2.87%) Security Analyst
15 14 (2.68%) Network Engineer
Libraries, Frameworks & Software Standards
1 19 (3.64%) Elastic Stack
2 16 (3.07%) ActiveMQ
2 16 (3.07%) Spring
3 15 (2.87%) Kafka
4 14 (2.68%) Boost C++ Libraries
4 14 (2.68%) JMS
4 14 (2.68%) Spring Boot
5 11 (2.11%) Node.js
6 10 (1.92%) LangChain
6 10 (1.92%) REST
7 8 (1.53%) .NET
7 8 (1.53%) SOAP
8 7 (1.34%) HTML
8 7 (1.34%) Leaflet
8 7 (1.34%) React
9 6 (1.15%) Oracle Fusion
10 5 (0.96%) Middleware
10 5 (0.96%) SailPoint
11 4 (0.77%) EDI
11 4 (0.77%) OAuth
Miscellaneous
1 49 (9.39%) Security Posture
2 32 (6.13%) Cyber Threat
3 31 (5.94%) Data Centre
4 23 (4.41%) Virtual Team
5 19 (3.64%) Data Structures
5 19 (3.64%) Enterprise Software
6 18 (3.45%) Algorithms
7 17 (3.26%) Onboarding
8 16 (3.07%) Cloud Native
8 16 (3.07%) Robotics
9 14 (2.68%) Credit Derivative
9 14 (2.68%) Equities
9 14 (2.68%) Hedge funds
9 14 (2.68%) Public Cloud
10 13 (2.49%) Foreign Exchange (FX)
10 13 (2.49%) Legacy Systems
11 12 (2.30%) Blockchain
12 11 (2.11%) CMDB
13 10 (1.92%) Data Protection Act
14 9 (1.72%) CSOC
Operating Systems
1 94 (18.01%) Linux
2 52 (9.96%) Windows
3 22 (4.21%) Windows Server
4 18 (3.45%) Unix
5 15 (2.87%) Windows 10
6 9 (1.72%) AIX
7 8 (1.53%) Red Hat Enterprise Linux
8 5 (0.96%) Robot Operating System
8 5 (0.96%) Windows Server 2019
9 3 (0.57%) Apple iOS
9 3 (0.57%) Mac OS X
9 3 (0.57%) Ubuntu
9 3 (0.57%) VMS
9 3 (0.57%) Windows Server 2016
10 2 (0.38%) Android
10 2 (0.38%) Mac OS
10 2 (0.38%) Windows 7
11 1 (0.19%) Debian
11 1 (0.19%) Windows Server 2008
Processes & Methodologies
1 125 (23.95%) Information Security
2 109 (20.88%) Computer Science
2 109 (20.88%) Cybersecurity
3 102 (19.54%) DevOps
4 89 (17.05%) Problem-Solving
5 86 (16.48%) Incident Response
6 84 (16.09%) Risk Management
7 81 (15.52%) Agile
8 77 (14.75%) Analytics
9 73 (13.98%) CI/CD
10 68 (13.03%) Project Management
11 66 (12.64%) Change Management
12 64 (12.26%) Data Management
12 64 (12.26%) Data Protection
13 60 (11.49%) Continuous Improvement
14 58 (11.11%) Mentoring
15 53 (10.15%) Cloud Security
15 53 (10.15%) Infrastructure as Code
15 53 (10.15%) Roadmaps
16 50 (9.58%) Decision-Making
Programming Languages
1 82 (15.71%) Python
2 81 (15.52%) SQL
3 41 (7.85%) Java
4 39 (7.47%) PowerShell
5 34 (6.51%) C++
6 16 (3.07%) JavaScript
6 16 (3.07%) T-SQL
7 13 (2.49%) C#
8 9 (1.72%) Bash
8 9 (1.72%) R
9 5 (0.96%) TypeScript
9 5 (0.96%) VBA
10 4 (0.77%) C
10 4 (0.77%) Data Analysis Expressions
11 3 (0.57%) Shell Script
12 2 (0.38%) Bicep
12 2 (0.38%) Rust
13 1 (0.19%) Go
13 1 (0.19%) Groovy
Qualifications
1 176 (33.72%) Degree
2 48 (9.20%) Computer Science Degree
3 45 (8.62%) Security Cleared
4 41 (7.85%) AWS Certification
5 35 (6.70%) CISSP
6 33 (6.32%) SC Cleared
7 22 (4.21%) Master's Degree
8 21 (4.02%) AWS Certified Solutions Architect
9 20 (3.83%) CISA
9 20 (3.83%) Cisco Certification
10 15 (2.87%) CISM
11 12 (2.30%) ISACA
12 11 (2.11%) DBS Check
13 9 (1.72%) (ISC)2 CCSP
13 9 (1.72%) CCSP
13 9 (1.72%) ITIL Certification
13 9 (1.72%) Microsoft Certification
14 8 (1.53%) CISMP
15 7 (1.34%) GCIA
15 7 (1.34%) GCIH
Quality Assurance & Compliance
1 66 (12.64%) GDPR
2 59 (11.30%) ISO/IEC 27001
3 57 (10.92%) NIST
4 22 (4.21%) PCI DSS
5 21 (4.02%) HIPAA
6 19 (3.64%) Data Quality
6 19 (3.64%) SLA
7 14 (2.68%) Cyber Essentials
8 13 (2.49%) ITGC
9 11 (2.11%) QA
10 10 (1.92%) Accessibility
11 6 (1.15%) COBIT
11 6 (1.15%) GRC
11 6 (1.15%) NIST 800
12 4 (0.77%) Cyber Essentials PLUS
12 4 (0.77%) ISO/IEC 27002 (supersedes ISO/IEC 17799)
12 4 (0.77%) PMO
12 4 (0.77%) SOC 2
13 3 (0.57%) Sarbanes-Oxley
14 1 (0.19%) ISO 9001
System Software
1 42 (8.05%) Docker
2 30 (5.75%) Active Directory
3 19 (3.64%) VMware Infrastructure
4 18 (3.45%) Virtual Machines
5 8 (1.53%) Hyper-V
6 4 (0.77%) Firmware
7 3 (0.57%) Veritas Cluster Server
7 3 (0.57%) vSphere
8 1 (0.19%) VMware ESXi
Systems Management
1 57 (10.92%) Terraform
2 47 (9.00%) Kubernetes
3 44 (8.43%) Ansible
4 26 (4.98%) SCCM
5 17 (3.26%) Prometheus
6 16 (3.07%) Microsoft Intune
7 13 (2.49%) Grafana
7 13 (2.49%) Single Sign-On
8 11 (2.11%) Puppet
9 10 (1.92%) Progress Chef
10 9 (1.72%) QRadar
11 5 (0.96%) CSIRT
12 4 (0.77%) Failover Clustering
13 3 (0.57%) CASB
13 3 (0.57%) Istio
13 3 (0.57%) linkerd
14 2 (0.38%) NetBackup
15 1 (0.19%) Active Directory Federation Services
15 1 (0.19%) Podman
Vendors
1 121 (23.18%) Microsoft
2 40 (7.66%) Oracle
3 32 (6.13%) Salesforce
4 31 (5.94%) Google
5 30 (5.75%) Cisco
5 30 (5.75%) ServiceNow
6 26 (4.98%) VMware
7 21 (4.02%) IBM
8 18 (3.45%) Citrix
8 18 (3.45%) SAP
9 14 (2.68%) Databricks
10 10 (1.92%) CheckPoint
10 10 (1.92%) Dynatrace
10 10 (1.92%) Red Hat
10 10 (1.92%) SolarWinds
11 8 (1.53%) Infoblox
11 8 (1.53%) Meraki
12 7 (1.34%) Juniper
13 6 (1.15%) ATG
13 6 (1.15%) Atlassian