Legal Jobs in London

Legal
England > London

The table below looks at the prevalence of the term Legal in permanent job vacancies in London. Included is a benchmarking guide to the salaries offered in vacancies that cited Legal over the 6 months leading up to 26 July 2024, comparing them to the same period in the previous two years.

6 months to
26 Jul 2024
Same period 2023 Same period 2022
Rank 51 109 126
Rank change year-on-year +58 +17 +45
Permanent jobs citing Legal 1,010 811 2,513
As % of all permanent jobs advertised in London 4.87% 2.99% 3.35%
As % of the General category 7.09% 4.42% 4.74%
Number of salaries quoted 578 557 949
10th Percentile £32,750 £36,050 £36,250
25th Percentile £42,500 £50,000 £50,000
Median annual salary (50th Percentile) £65,000 £64,000 £65,000
Median % change year-on-year +1.56% -1.54% +8.33%
75th Percentile £80,000 £83,750 £83,750
90th Percentile £96,975 £100,000 £105,000
England median annual salary £50,000 £55,000 £55,000
% change year-on-year -9.09% - +4.76%

All General Skills
London

Legal falls under the General Skills category. For comparison with the information above, the following table provides summary statistics for all permanent job vacancies requiring common skills in London.

Permanent vacancies with a requirement for common skills 14,244 18,353 53,034
As % of all permanent jobs advertised in London 68.68% 67.67% 70.70%
Number of salaries quoted 9,429 13,938 24,332
10th Percentile £37,000 £41,250 £41,250
25th Percentile £51,250 £53,750 £52,500
Median annual salary (50th Percentile) £72,500 £73,993 £70,000
Median % change year-on-year -2.02% +5.70% -
75th Percentile £95,000 £95,000 £92,500
90th Percentile £122,500 £120,000 £112,500
England median annual salary £55,000 £60,000 £60,000
% change year-on-year -8.33% - +4.35%

Legal
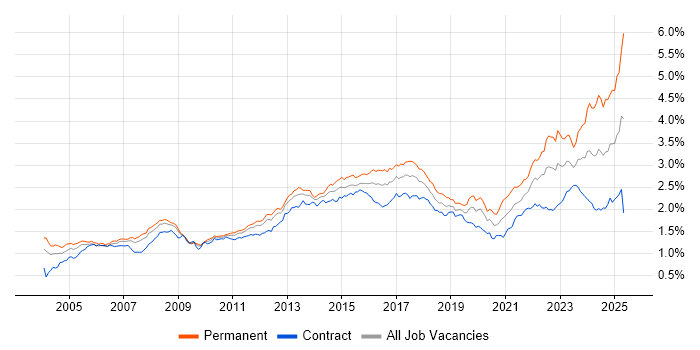
Job Vacancy Trend in London

Job postings citing Legal as a proportion of all IT jobs advertised in London.

Job vacancy trend for Legal in London

Legal
Salary Trend in London

3-month moving average salary quoted in jobs citing Legal in London.

Salary trend for Legal in London

Legal
Salary Histogram in London

Salary distribution for jobs citing Legal in London over the 6 months to 26 July 2024.

Salary histogram for Legal in London

Legal
Job Locations in London

The table below looks at the demand and provides a guide to the median salaries quoted in IT jobs citing Legal within the London region over the 6 months to 26 July 2024. The 'Rank Change' column provides an indication of the change in demand within each location based on the same 6 month period last year.

Location Rank Change
on Same Period
Last Year
Matching
Permanent
IT Job Ads
Median Salary
Past 6 Months
Median Salary
% Change
on Same Period
Last Year
Live
Jobs
Central London +41 177 £60,000 -4.00% 63
South London +16 38 £55,000 +9.45% 5
West London -1 13 £85,000 +30.77% 21
East London +10 2 £48,036 +31.61% 23
Legal
England

Legal
Co-occurring Skills and Capabilities in London by Category

The follow tables expand on the table above by listing co-occurrences grouped by category. The same employment type, locality and period is covered with up to 20 co-occurrences shown in each of the following categories:

Application Platforms
1 51 (5.05%) SharePoint
2 28 (2.77%) Microsoft Exchange
3 17 (1.68%) SAS
4 16 (1.58%) CMS
5 8 (0.79%) Apache Spark
6 5 (0.50%) IIS
7 4 (0.40%) Apache
7 4 (0.40%) Apache Pulsar
8 3 (0.30%) Drupal
8 3 (0.30%) nginx
9 2 (0.20%) WordPress
10 1 (0.099%) Confluence
10 1 (0.099%) Documentum
10 1 (0.099%) WebSphere
Applications
1 138 (13.66%) Microsoft Excel
2 128 (12.67%) Microsoft Office
3 30 (2.97%) Microsoft PowerPoint
4 10 (0.99%) MS Visio
5 8 (0.79%) SPSS
6 6 (0.59%) Microsoft Project
7 4 (0.40%) Spreadsheet
8 3 (0.30%) Adobe Creative Suite
8 3 (0.30%) AutoCAD
9 2 (0.20%) FileZilla
10 1 (0.099%) Camtasia
10 1 (0.099%) Chatbot
10 1 (0.099%) InVision
10 1 (0.099%) Revit
10 1 (0.099%) Sketch
10 1 (0.099%) Trello
10 1 (0.099%) Zeplin
Business Applications
1 44 (4.36%) Ripple
2 32 (3.17%) Elite 3E
3 24 (2.38%) Dynamics CRM
4 11 (1.09%) Relativity
5 6 (0.59%) NetSuite
6 4 (0.40%) Carpe Diem
6 4 (0.40%) Primavera
7 3 (0.30%) Raiser’s Edge
7 3 (0.30%) SAP Payroll
8 2 (0.20%) Salesforce CRM
8 2 (0.20%) SAP HR
8 2 (0.20%) Veritas eDiscovery
8 2 (0.20%) Visualfiles
9 1 (0.099%) Adobe Campaign
9 1 (0.099%) Data Workbench
9 1 (0.099%) Dynamics AX
9 1 (0.099%) Endur
9 1 (0.099%) NEC Housing
9 1 (0.099%) Remedy ITSM
9 1 (0.099%) SAP ERP
Cloud Services
1 139 (13.76%) Azure
2 81 (8.02%) AWS
3 80 (7.92%) Microsoft 365
4 62 (6.14%) GCP
5 54 (5.35%) Power Platform
6 47 (4.65%) SaaS
7 24 (2.38%) Dynamics 365
7 24 (2.38%) PaaS
8 21 (2.08%) Entra ID
9 13 (1.29%) Azure Synapse Analytics
9 13 (1.29%) PowerApps
10 10 (0.99%) Azure Cosmos DB
11 9 (0.89%) Azure Data Factory
11 9 (0.89%) IaaS
11 9 (0.89%) WhatsApp
12 8 (0.79%) GitHub
13 7 (0.69%) Cloud Computing
13 7 (0.69%) Figma
14 5 (0.50%) Azure DevOps
14 5 (0.50%) Serverless
Communications & Networking
1 40 (3.96%) Firewall
2 31 (3.07%) Internet
3 20 (1.98%) WAN
4 15 (1.49%) LAN
5 9 (0.89%) Intranet
5 9 (0.89%) WebEx
6 8 (0.79%) Wireless
7 7 (0.69%) Intrusion Detection
8 6 (0.59%) Network Security
8 6 (0.59%) Remote Desktop
8 6 (0.59%) SD-WAN
8 6 (0.59%) VPN
9 5 (0.50%) DNS
9 5 (0.50%) TCP/IP
9 5 (0.50%) Telepresence
9 5 (0.50%) Wi-Fi
10 4 (0.40%) Cisco Nexus
11 3 (0.30%) Skype
11 3 (0.30%) SNMP
11 3 (0.30%) VoIP
Database & Business Intelligence
1 42 (4.16%) Power BI
2 31 (3.07%) SQL Server
3 16 (1.58%) Amazon Aurora
4 15 (1.49%) SQL Server Reporting Services
5 14 (1.39%) Data Lake
5 14 (1.39%) Relational Database
6 13 (1.29%) DynamoDB
6 13 (1.29%) Tableau
7 12 (1.19%) Big Data
7 12 (1.19%) Data Warehouse
7 12 (1.19%) EDRMS
8 5 (0.50%) MS Access
8 5 (0.50%) MySQL
8 5 (0.50%) PostgreSQL
8 5 (0.50%) RDBMS
9 4 (0.40%) BigQuery
9 4 (0.40%) Bigtable
9 4 (0.40%) Essbase
9 4 (0.40%) Hadoop
9 4 (0.40%) NoSQL
Development Applications
1 23 (2.28%) JIRA
2 12 (1.19%) Git
3 6 (0.59%) Visual Studio
4 5 (0.50%) CircleCI
4 5 (0.50%) fastlane
4 5 (0.50%) Jenkins
4 5 (0.50%) Selenium
5 3 (0.30%) WebDriver
6 2 (0.20%) Appium
6 2 (0.20%) Cucumber
6 2 (0.20%) GitLab
6 2 (0.20%) JUnit
6 2 (0.20%) LoadRunner
6 2 (0.20%) NeoLoad
6 2 (0.20%) SoapUI
6 2 (0.20%) SQL Server Management Studio (SSMS)
6 2 (0.20%) TestNG
6 2 (0.20%) TestRail
7 1 (0.099%) Katalon Studio
7 1 (0.099%) SonarQube
General
1 417 (41.29%) Finance
2 346 (34.26%) Social Skills
3 328 (32.48%) Law
4 158 (15.64%) Analytical Skills
5 100 (9.90%) Inclusion and Diversity
6 87 (8.61%) Marketing
7 78 (7.72%) Banking
8 61 (6.04%) Financial Institution
9 58 (5.74%) Retail
10 46 (4.55%) Organisational Skills
11 31 (3.07%) Influencing Skills
12 21 (2.08%) Publishing
13 19 (1.88%) Public Sector
14 16 (1.58%) Documentation Skills
15 13 (1.29%) Advertising
15 13 (1.29%) Presentation Skills
16 9 (0.89%) Games
16 9 (0.89%) Military
16 9 (0.89%) Multimedia
17 6 (0.59%) Investment Banking
Job Titles
1 256 (25.35%) Analyst
2 208 (20.59%) Senior
3 81 (8.02%) Software Engineer
4 74 (7.33%) Lead
5 62 (6.14%) Developer
6 58 (5.74%) Senior Analyst
7 48 (4.75%) Audio Visual Technician
8 39 (3.86%) Senior Manager
9 36 (3.56%) IT Manager
9 36 (3.56%) Project Manager
10 35 (3.47%) Senior Software Engineer
11 29 (2.87%) Financial Analyst
12 28 (2.77%) IT Analyst
13 26 (2.57%) Support Analyst
14 25 (2.48%) Business Analyst
14 25 (2.48%) Security Manager
15 24 (2.38%) Administrator
16 23 (2.28%) Java Engineer
16 23 (2.28%) Java Software Engineer
17 22 (2.18%) Senior Developer
Libraries, Frameworks & Software Standards
1 51 (5.05%) HTML
2 49 (4.85%) React
3 36 (3.56%) Spring
4 26 (2.57%) CSS
5 21 (2.08%) .NET
6 18 (1.78%) PySpark
7 13 (1.29%) Swagger
8 11 (1.09%) Blazor
9 10 (0.99%) REST
10 8 (0.79%) FastAPI
10 8 (0.79%) RESTful
10 8 (0.79%) Web Services
11 7 (0.69%) Flash
11 7 (0.69%) JSON
11 7 (0.69%) OAuth
11 7 (0.69%) OpenID
11 7 (0.69%) RabbitMQ
11 7 (0.69%) Ruby on Rails
12 6 (0.59%) Spring Boot
13 5 (0.50%) Kafka
Miscellaneous
1 63 (6.24%) Management Information System
2 60 (5.94%) Onboarding
3 49 (4.85%) Blockchain
4 48 (4.75%) Cloud Native
5 30 (2.97%) NFT
6 29 (2.87%) Distributed Systems
6 29 (2.87%) Product Ownership
7 28 (2.77%) Data Structures
8 24 (2.38%) Algorithms
8 24 (2.38%) Self-Motivation
9 22 (2.18%) Driving Licence
10 20 (1.98%) Security Posture
10 20 (1.98%) Video Conferencing
11 18 (1.78%) Foreign Exchange (FX)
12 16 (1.58%) Enterprise Software
12 16 (1.58%) Life Science
13 13 (1.29%) Analytical Mindset
14 12 (1.19%) Distributed Computing
15 10 (0.99%) Social Media
16 9 (0.89%) Digital Media
Operating Systems
1 77 (7.62%) Windows
2 31 (3.07%) Windows 10
3 19 (1.88%) Windows Server
4 16 (1.58%) Android
5 12 (1.19%) Apple iOS
6 5 (0.50%) Mac OS
7 4 (0.40%) Linux
8 2 (0.20%) Mac OS X
9 1 (0.099%) Unix
9 1 (0.099%) Windows Server 2016
9 1 (0.099%) Windows Server 2019
Processes & Methodologies
1 223 (22.08%) Problem-Solving
2 219 (21.68%) Agile
3 123 (12.18%) Risk Management
4 104 (10.30%) Software Engineering
5 101 (10.00%) Project Management
6 100 (9.90%) Computer Science
7 97 (9.60%) Information Security
8 92 (9.11%) Analytics
9 91 (9.01%) Mentoring
10 88 (8.71%) Time Management
11 86 (8.51%) Cybersecurity
12 85 (8.42%) Data Management
13 83 (8.22%) Business Development
14 81 (8.02%) Decision-Making
15 77 (7.62%) Artificial Intelligence
16 70 (6.93%) Business Intelligence
16 70 (6.93%) Customer Service
16 70 (6.93%) Roadmaps
17 69 (6.83%) Fintech
18 67 (6.63%) Continuous Improvement
Programming Languages
1 127 (12.57%) SQL
2 103 (10.20%) Python
3 87 (8.61%) Java
4 64 (6.34%) JavaScript
5 36 (3.56%) Go
6 30 (2.97%) Rust
6 30 (2.97%) Solidity
7 29 (2.87%) TypeScript
8 23 (2.28%) Kotlin
8 23 (2.28%) PowerShell
9 21 (2.08%) C#
10 20 (1.98%) T-SQL
11 18 (1.78%) Scala
12 10 (0.99%) Ruby
13 8 (0.79%) C++
14 5 (0.50%) C
15 3 (0.30%) Bicep
15 3 (0.30%) R
15 3 (0.30%) RPG
16 2 (0.20%) VBA
Qualifications
1 247 (24.46%) Degree
2 45 (4.46%) APMG
3 43 (4.26%) Master's Degree
4 41 (4.06%) CISSP
5 28 (2.77%) CISA
6 23 (2.28%) Computer Science Degree
7 22 (2.18%) DBS Check
8 21 (2.08%) CISM
9 19 (1.88%) HNC
10 16 (1.58%) MRICS
10 16 (1.58%) PhD
11 15 (1.49%) ACCA
12 13 (1.29%) RIBA
13 12 (1.19%) Cisco Certification
14 9 (0.89%) Microsoft Certification
15 8 (0.79%) Security Cleared
16 7 (0.69%) GIAC
16 7 (0.69%) HND
17 6 (0.59%) CRISC
17 6 (0.59%) ITIL Certification
Quality Assurance & Compliance
1 69 (6.83%) ISO/IEC 27001
2 57 (5.64%) QA
3 50 (4.95%) GDPR
4 31 (3.07%) Data Quality
5 30 (2.97%) NIST
6 22 (2.18%) GAAP
7 17 (1.68%) Cyber Essentials
7 17 (1.68%) GRC
7 17 (1.68%) Sarbanes-Oxley
8 13 (1.29%) IFRS
9 12 (1.19%) Accessibility
10 11 (1.09%) Cyber Essentials PLUS
11 9 (0.89%) SLA
12 7 (0.69%) COBIT
13 5 (0.50%) NIST 800
14 4 (0.40%) California Consumer Privacy Act
14 4 (0.40%) IFRS 9
14 4 (0.40%) NEBOSH
14 4 (0.40%) PCI DSS
14 4 (0.40%) PMO
System Software
1 45 (4.46%) Active Directory
2 40 (3.96%) Docker
3 8 (0.79%) Firmware
4 6 (0.59%) RACF
4 6 (0.59%) VMware Infrastructure
5 4 (0.40%) VMware ESXi
6 2 (0.20%) Hyper-V
6 2 (0.20%) Virtual Desktop
7 1 (0.099%) vSphere
Systems Management
1 62 (6.14%) Kubernetes
2 11 (1.09%) SCCM
3 10 (0.99%) Ansible
3 10 (0.99%) Microsoft Intune
4 8 (0.79%) Terraform
5 7 (0.69%) FortiGate
6 6 (0.59%) Single Sign-On
7 4 (0.40%) SCOM
8 3 (0.30%) AirWatch
8 3 (0.30%) Istio
9 2 (0.20%) Argo
9 2 (0.20%) Jamf Pro
9 2 (0.20%) Progress Chef
9 2 (0.20%) Puppet
9 2 (0.20%) QRadar
10 1 (0.099%) Active Directory Federation Services
10 1 (0.099%) Control-M
10 1 (0.099%) Oracle Identity Management
10 1 (0.099%) SCOrch
10 1 (0.099%) vCenter Server
Vendors
1 241 (23.86%) Microsoft
2 51 (5.05%) iManage
3 37 (3.66%) Intapp
4 25 (2.48%) Google
5 22 (2.18%) Cisco
6 20 (1.98%) Databricks
6 20 (1.98%) ServiceNow
7 19 (1.88%) Aderant
8 16 (1.58%) Citrix
8 16 (1.58%) OpenAI
9 11 (1.09%) SAP
10 10 (0.99%) VMware
11 9 (0.89%) Adobe
11 9 (0.89%) Alteryx
11 9 (0.89%) Nuix
11 9 (0.89%) Palo Alto
11 9 (0.89%) Salesforce
12 8 (0.79%) Oracle
13 7 (0.69%) HP
13 7 (0.69%) NEC