Billing Jobs in London

Billing
England > London

The table below looks at the prevalence of the term Billing in permanent job vacancies in London. Included is a benchmarking guide to the salaries offered in vacancies that cited Billing over the 6 months leading up to 26 July 2024, comparing them to the same period in the previous two years.

6 months to
26 Jul 2024
Same period 2023 Same period 2022
Rank 342 371 682
Rank change year-on-year +29 +311 -174
Permanent jobs citing Billing 135 194 245
As % of all permanent jobs advertised in London 0.65% 0.72% 0.33%
As % of the General category 0.95% 1.06% 0.46%
Number of salaries quoted 34 58 103
10th Percentile £45,000 £53,750 £31,250
25th Percentile £52,500 £62,813 £51,250
Median annual salary (50th Percentile) £70,000 £80,000 £67,500
Median % change year-on-year -12.50% +18.52% +3.85%
75th Percentile £82,813 £102,188 £75,925
90th Percentile £87,500 £120,000 £97,500
England median annual salary £26,500 £57,500 £57,500
% change year-on-year -53.91% - -4.17%

All General Skills
London

Billing falls under the General Skills category. For comparison with the information above, the following table provides summary statistics for all permanent job vacancies requiring common skills in London.

Permanent vacancies with a requirement for common skills 14,244 18,353 53,034
As % of all permanent jobs advertised in London 68.68% 67.67% 70.70%
Number of salaries quoted 9,429 13,938 24,332
10th Percentile £37,000 £41,250 £41,250
25th Percentile £51,250 £53,750 £52,500
Median annual salary (50th Percentile) £72,500 £73,993 £70,000
Median % change year-on-year -2.02% +5.70% -
75th Percentile £95,000 £95,000 £92,500
90th Percentile £122,500 £120,000 £112,500
England median annual salary £55,000 £60,000 £60,000
% change year-on-year -8.33% - +4.35%

Billing
Job Vacancy Trend in London

Job postings citing Billing as a proportion of all IT jobs advertised in London.
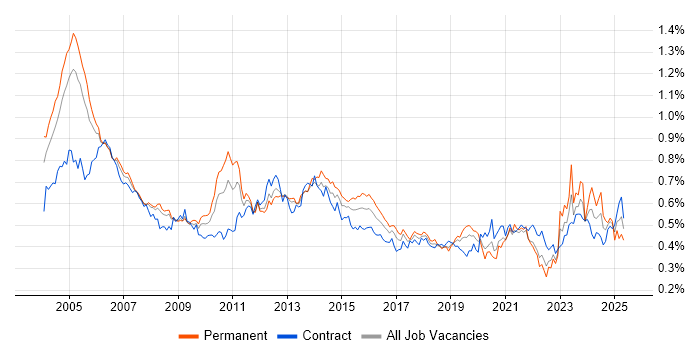
Job vacancy trend for Billing in London

Billing
Salary Trend in London

3-month moving average salary quoted in jobs citing Billing in London.

Salary trend for Billing in London

Billing
Salary Histogram in London

Salary distribution for jobs citing Billing in London over the 6 months to 26 July 2024.

Salary histogram for Billing in London

Billing
Job Locations in London

The table below looks at the demand and provides a guide to the median salaries quoted in IT jobs citing Billing within the London region over the 6 months to 26 July 2024. The 'Rank Change' column provides an indication of the change in demand within each location based on the same 6 month period last year.

Location Rank Change
on Same Period
Last Year
Matching
Permanent
IT Job Ads
Median Salary
Past 6 Months
Median Salary
% Change
on Same Period
Last Year
Live
Jobs
Central London +38 7 £75,000 +62.16% 6
North London -5 1 £62,500 -
Billing
England

Billing
Co-occurring Skills and Capabilities in London by Category

The follow tables expand on the table above by listing co-occurrences grouped by category. The same employment type, locality and period is covered with up to 20 co-occurrences shown in each of the following categories:

Application Platforms
1 2 (1.48%) CMS
2 1 (0.74%) SharePoint
Applications
1 7 (5.19%) Microsoft Office
2 4 (2.96%) Microsoft Excel
3 2 (1.48%) Chatbot
4 1 (0.74%) Microsoft PowerPoint
Business Applications
1 5 (3.70%) SAP S/4HANA
2 4 (2.96%) NetSuite
3 3 (2.22%) SAP SD
4 2 (1.48%) Salesforce CRM
5 1 (0.74%) Elite 3E
5 1 (0.74%) Oracle Applications
5 1 (0.74%) Oracle Assets
5 1 (0.74%) Oracle EBS
5 1 (0.74%) Oracle EBS R12
5 1 (0.74%) Oracle E-Business Tax
5 1 (0.74%) Oracle ERP
5 1 (0.74%) Oracle General Ledger
5 1 (0.74%) Oracle Internet Expenses
5 1 (0.74%) Oracle iProcurement
5 1 (0.74%) Oracle Payables
5 1 (0.74%) Oracle Receivables
5 1 (0.74%) Relativity
Cloud Services
1 7 (5.19%) SaaS
2 6 (4.44%) Azure
3 4 (2.96%) Microsoft 365
4 3 (2.22%) AWS
4 3 (2.22%) PaaS
5 2 (1.48%) Entra ID
5 2 (1.48%) IaaS
5 2 (1.48%) OCI
6 1 (0.74%) Azure App Service
6 1 (0.74%) Azure DevOps
6 1 (0.74%) Azure Key Vault
6 1 (0.74%) Azure Monitor
6 1 (0.74%) Azure Service Bus
6 1 (0.74%) Azure Synapse Analytics
6 1 (0.74%) Google Sheets
6 1 (0.74%) Power Platform
6 1 (0.74%) Serverless
Communications & Networking
1 5 (3.70%) Firewall
2 3 (2.22%) LAN
3 2 (1.48%) Intranet
3 2 (1.48%) Unified Communications
3 2 (1.48%) VoIP
4 1 (0.74%) BGP
4 1 (0.74%) DNS
4 1 (0.74%) Internet
4 1 (0.74%) PSTN
4 1 (0.74%) SAN
4 1 (0.74%) VLAN
4 1 (0.74%) VPN
Database & Business Intelligence
1 3 (2.22%) SQL Server
2 1 (0.74%) Azure SQL Database
2 1 (0.74%) BusinessObjects
2 1 (0.74%) BusinessObjects Business Intelligence
2 1 (0.74%) Data Vault
2 1 (0.74%) Data Warehouse
2 1 (0.74%) EDRMS
2 1 (0.74%) Metadata
2 1 (0.74%) Power BI
2 1 (0.74%) SQL Server Reporting Services
Development Applications
1 3 (2.22%) Selenium
2 1 (0.74%) Toad
2 1 (0.74%) Visual Studio
General
1 107 (79.26%) Finance
2 65 (48.15%) Social Skills
3 54 (40.00%) Inclusion and Diversity
4 36 (26.67%) Presentation Skills
5 20 (14.81%) Marketing
6 17 (12.59%) Retail
7 16 (11.85%) Manufacturing
8 10 (7.41%) Analytical Skills
9 6 (4.44%) Law
10 4 (2.96%) General Ledger
10 4 (2.96%) Legal
11 3 (2.22%) Organisational Skills
12 2 (1.48%) Banking
12 2 (1.48%) Telecoms
13 1 (0.74%) Documentation Skills
13 1 (0.74%) Local Government
Job Titles
1 36 (26.67%) Audit Manager
2 21 (15.56%) Infrastructure Manager
3 17 (12.59%) Senior
4 13 (9.63%) Senior Audit Manager
4 13 (9.63%) Senior Infrastructure Manager
4 13 (9.63%) Senior Manager
5 8 (5.93%) Associate Director
5 8 (5.93%) Environment Manager
6 7 (5.19%) Consultant
6 7 (5.19%) IT Manager
7 6 (4.44%) Lead
8 5 (3.70%) Project Manager
9 4 (2.96%) Developer
9 4 (2.96%) NetSuite Developer
9 4 (2.96%) SAP Consultant
9 4 (2.96%) SAP SD Consultant
10 3 (2.22%) Analyst
10 3 (2.22%) Architect
10 3 (2.22%) Operations Manager
10 3 (2.22%) Software Tester
Libraries, Frameworks & Software Standards
1 5 (3.70%) SAP Fiori
2 4 (2.96%) Restlet
2 4 (2.96%) Web Services
3 3 (2.22%) JSON
4 1 (0.74%) ARM Templates
4 1 (0.74%) Oracle Fusion
4 1 (0.74%) Spring Cloud
Miscellaneous
1 23 (17.04%) Reinsurance
2 9 (6.67%) Self-Motivation
3 6 (4.44%) Blog
4 4 (2.96%) Data Centre
5 3 (2.22%) Life Science
5 3 (2.22%) Tandem
6 2 (1.48%) Freedom of Information
6 2 (1.48%) Learning Management System
6 2 (1.48%) Management Information System
6 2 (1.48%) Public Cloud
7 1 (0.74%) Data Protection Act
7 1 (0.74%) Data Structures
7 1 (0.74%) Onboarding
7 1 (0.74%) Private Cloud
7 1 (0.74%) Replication
Operating Systems
1 4 (2.96%) Windows
2 1 (0.74%) Linux
2 1 (0.74%) SUSE
2 1 (0.74%) Ubuntu
2 1 (0.74%) VMS
2 1 (0.74%) Windows Server
2 1 (0.74%) Windows Server 2012
Processes & Methodologies
1 94 (69.63%) Problem-Solving
2 85 (62.96%) Business Development
3 84 (62.22%) Coaching
4 70 (51.85%) People Management
5 67 (49.63%) Performance Management
5 67 (49.63%) Service Management
6 37 (27.41%) Agile
7 24 (17.78%) Project Management
8 14 (10.37%) Project Delivery
9 10 (7.41%) Business Strategy
10 9 (6.67%) Commercial Awareness
10 9 (6.67%) Thought Leadership
10 9 (6.67%) Wealth Management
11 8 (5.93%) Financial Modelling
11 8 (5.93%) Line Management
11 8 (5.93%) Proactive Management
12 6 (4.44%) E-Commerce
12 6 (4.44%) Requirements Gathering
13 5 (3.70%) Data Protection
13 5 (3.70%) User Stories
Programming Languages
1 7 (5.19%) SQL
2 3 (2.22%) PowerShell
2 3 (2.22%) Python
3 2 (1.48%) Java
3 2 (1.48%) JavaScript
4 1 (0.74%) Bash
4 1 (0.74%) T-SQL
Qualifications
1 77 (57.04%) ACCA
2 7 (5.19%) Degree
3 5 (3.70%) Security Cleared
4 4 (2.96%) Computer Science Degree
5 2 (1.48%) DV Cleared
5 2 (1.48%) Postgraduate
6 1 (0.74%) BPSS Clearance
6 1 (0.74%) CIMA
6 1 (0.74%) DBS Check
6 1 (0.74%) MCSA
6 1 (0.74%) MCSE
6 1 (0.74%) Microsoft Certification
6 1 (0.74%) SAP Certification
6 1 (0.74%) VMware Certified Professional (VCP)
Quality Assurance & Compliance
1 69 (51.11%) GAAP
1 69 (51.11%) IFRS
2 3 (2.22%) GDPR
3 1 (0.74%) Data Quality
3 1 (0.74%) GMP
System Software
1 5 (3.70%) Active Directory
2 1 (0.74%) vCloud
2 1 (0.74%) Virtual Machines
2 1 (0.74%) VMware Infrastructure
2 1 (0.74%) vSphere
Systems Management
1 1 (0.74%) Ansible
1 1 (0.74%) Data Guard
1 1 (0.74%) Kubernetes
1 1 (0.74%) Terraform
Vendors
1 76 (56.30%) CA
2 61 (45.19%) Microsoft
3 9 (6.67%) SAP
4 4 (2.96%) VMware
5 3 (2.22%) Citrix
5 3 (2.22%) Oracle
5 3 (2.22%) Twitter
6 2 (1.48%) Salesforce
7 1 (0.74%) Aderant
7 1 (0.74%) Fujitsu
7 1 (0.74%) Google
7 1 (0.74%) HP
7 1 (0.74%) Nuix
7 1 (0.74%) ServiceNow
7 1 (0.74%) Veeam