Legacy Systems Job Trends in London

Legacy System
England > London

The table below looks at the prevalence of the term Legacy Systems in permanent job vacancies in London. Included is a benchmarking guide to the salaries offered in vacancies that cited Legacy Systems over the 6 months leading up to 2 November 2025, comparing them to the same period in the previous two years.

6 months to
2 Nov 2025
Same period 2024 Same period 2023
Rank 198 350 355
Rank change year-on-year +152 +5 +51
Permanent jobs citing Legacy Systems 192 108 108
As % of all permanent jobs in London 1.59% 0.62% 0.55%
As % of the Miscellaneous category 3.48% 1.51% 1.33%
Number of salaries quoted 90 76 99
10th Percentile £52,500 £40,000 £56,250
25th Percentile £56,250 £48,625 £62,625
Median annual salary (50th Percentile) £77,500 £70,000 £82,500
Median % change year-on-year +10.71% -15.15% -
75th Percentile £92,500 £120,938 £90,625
90th Percentile £105,125 £152,500 £113,000
England median annual salary £67,500 £53,500 £65,000
% change year-on-year +26.17% -17.69% -7.14%

All Generic Skills
London

Legacy Systems falls under the General and Transferable Skills category. For comparison with the information above, the following table provides summary statistics for all permanent job vacancies requiring generic IT skills in London.

Permanent vacancies with a requirement for generic IT skills 5,519 7,161 8,126
As % of all permanent jobs advertised in London 45.70% 41.29% 41.38%
Number of salaries quoted 3,297 4,013 6,395
10th Percentile £36,250 £45,000 £41,250
25th Percentile £51,250 £56,250 £56,250
Median annual salary (50th Percentile) £75,000 £80,000 £77,500
Median % change year-on-year -6.25% +3.23% +3.33%
75th Percentile £105,000 £108,750 £100,000
90th Percentile £132,500 £135,000 £128,250
England median annual salary £54,250 £60,000 £62,500
% change year-on-year -9.58% -4.00% -

Legacy Systems
Job Vacancy Trend in London

Historical trend showing the proportion of permanent IT job postings citing Legacy Systems relative to all permanent IT jobs advertised in London.
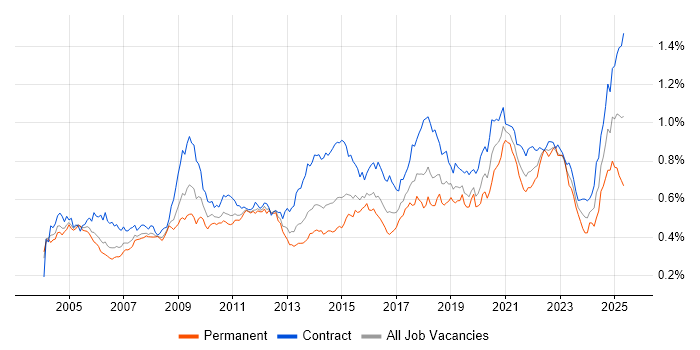
Legacy Systems job vacancy trend in London

Legacy Systems
Salary Trend in London

Salary distribution trend for jobs in London citing Legacy Systems.

Salary distribution trend for jobs in London citing Legacy Systems

Legacy Systems
Salary Histogram in London

Salary distribution for jobs citing Legacy Systems in London over the 6 months to 2 November 2025.

Salary histogram for Legacy Systems in London

Legacy Systems
Job Locations in London

The table below looks at the demand and provides a guide to the median salaries quoted in IT jobs citing Legacy Systems within the London region over the 6 months to 2 November 2025. The 'Rank Change' column provides an indication of the change in demand within each location based on the same 6 month period last year.

Location Rank Change
on Same Period
Last Year
Matching
Permanent
IT Job Ads
Median Salary
Past 6 Months
Median Salary
% Change
on Same Period
Last Year
Live
Jobs
Central London +60 22 £66,250 -17.19% 43
West London +15 5 - -
South London +22 1 - - 3
Legacy Systems
England

Legacy Systems
Co-Occurring Skills & Capabilities in London by Category

The following tables expand on the one above by listing co-occurrences grouped by category. They cover the same employment type, locality and period, with up to 20 co-occurrences shown in each category:

Application Platforms
1 7 (3.65%) Apache
1 7 (3.65%) Apache Airflow
1 7 (3.65%) Apache Spark
1 7 (3.65%) SharePoint
2 4 (2.08%) Apache Synapse
3 3 (1.56%) Microsoft Exchange
4 2 (1.04%) Confluence
5 1 (0.52%) nginx
5 1 (0.52%) SAS
Applications
1 11 (5.73%) Microsoft Office
2 3 (1.56%) Microsoft Excel
3 2 (1.04%) Microsoft PowerPoint
Business Applications
1 3 (1.56%) Shopify
2 2 (1.04%) SAP S/4HANA
3 1 (0.52%) Aladdin
3 1 (0.52%) Dynamics CRM
3 1 (0.52%) NetSuite
3 1 (0.52%) SAP MDG
Cloud Services
1 52 (27.08%) Azure
2 47 (24.48%) AWS
3 25 (13.02%) Amazon Bedrock
3 25 (13.02%) Vertex AI
4 17 (8.85%) SaaS
5 16 (8.33%) Power Platform
6 13 (6.77%) Azure DevOps
7 9 (4.69%) GCP
8 8 (4.17%) Dynamics 365
9 7 (3.65%) Microsoft 365
10 6 (3.13%) ChatGPT
10 6 (3.13%) GitHub
10 6 (3.13%) GitHub Copilot
10 6 (3.13%) IaaS
10 6 (3.13%) PaaS
11 5 (2.60%) Azure Logic Apps
11 5 (2.60%) Microsoft Purview
11 5 (2.60%) Serverless
11 5 (2.60%) Snowflake
12 4 (2.08%) Azure Data Factory
Communications & Networking
1 4 (2.08%) Firewall
1 4 (2.08%) WAN
2 3 (1.56%) Intranet
2 3 (1.56%) LAN
2 3 (1.56%) SD-WAN
2 3 (1.56%) Wi-Fi
3 2 (1.04%) Extranet
3 2 (1.04%) SAN
3 2 (1.04%) TCP/IP
4 1 (0.52%) DHCP
4 1 (0.52%) DNS
4 1 (0.52%) Fibre Channel
4 1 (0.52%) iSCSI
4 1 (0.52%) NAS
4 1 (0.52%) Network Security
4 1 (0.52%) PSTN
4 1 (0.52%) Unified Communications
4 1 (0.52%) VoIP
4 1 (0.52%) VPN
Database & Business Intelligence
1 62 (32.29%) SQL Server
2 44 (22.92%) MySQL
3 10 (5.21%) SQL Server Integration Services
4 8 (4.17%) Power BI
5 7 (3.65%) Relational Database
6 6 (3.13%) NoSQL
7 4 (2.08%) Amazon Redshift
7 4 (2.08%) Big Data
7 4 (2.08%) BigQuery
7 4 (2.08%) Data Mining
8 3 (1.56%) Delta Lake
8 3 (1.56%) Metadata
9 2 (1.04%) Data Vault
9 2 (1.04%) Hadoop
9 2 (1.04%) Oracle Database
9 2 (1.04%) PostgreSQL
9 2 (1.04%) Snowflake Schema
10 1 (0.52%) Data Lake
10 1 (0.52%) SAS EBI
10 1 (0.52%) Tableau
Development Applications
1 11 (5.73%) ERwin
2 8 (4.17%) Octopus Deploy
3 7 (3.65%) Jenkins
4 6 (3.13%) TeamCity
5 5 (2.60%) Git
6 4 (2.08%) JIRA
7 2 (1.04%) Artifactory
7 2 (1.04%) GitLab
8 1 (0.52%) JMeter
8 1 (0.52%) JUnit
8 1 (0.52%) Mockito
8 1 (0.52%) Synon
8 1 (0.52%) Vite
General
1 84 (43.75%) Social Skills
2 52 (27.08%) Analytical Skills
3 38 (19.79%) Finance
4 15 (7.81%) Banking
5 10 (5.21%) Investment Banking
6 9 (4.69%) Public Sector
7 8 (4.17%) Law
8 7 (3.65%) Inclusion and Diversity
8 7 (3.65%) Legal
9 5 (2.60%) Documentation Skills
10 4 (2.08%) Retail
11 3 (1.56%) Local Government
12 2 (1.04%) Back Office
12 2 (1.04%) Marketing
12 2 (1.04%) Music Industry
13 1 (0.52%) Front Office
13 1 (0.52%) International Banking
13 1 (0.52%) Wholesale Banking
Job Titles
1 71 (36.98%) Consultant
2 42 (21.88%) Senior
3 33 (17.19%) Architect
4 30 (15.63%) Developer
5 26 (13.54%) Senior Consultant
6 25 (13.02%) Gen AI Consultant
7 24 (12.50%) Lead
8 13 (6.77%) Data Architect
9 11 (5.73%) Lead Architect
9 11 (5.73%) Lead Data Architect
10 10 (5.21%) Senior Developer
10 10 (5.21%) Solutions Architect
11 9 (4.69%) CRM Manager
11 9 (4.69%) Lead Developer
11 9 (4.69%) Platform Manager
12 7 (3.65%) Analyst
12 7 (3.65%) Enterprise Architect
13 6 (3.13%) Artificial Intelligence Developer
13 6 (3.13%) Data Engineer
13 6 (3.13%) DevOps Engineer
Libraries, Frameworks & Software Standards
1 25 (13.02%) LangChain
2 12 (6.25%) REST
3 9 (4.69%) Laravel
4 8 (4.17%) .NET
4 8 (4.17%) Kafka
5 6 (3.13%) React
5 6 (3.13%) Tailwind CSS
6 5 (2.60%) Alpine.js
6 5 (2.60%) Pandas
6 5 (2.60%) Vue
7 4 (2.08%) Apache Beam
7 4 (2.08%) Hibernate
7 4 (2.08%) Spring
7 4 (2.08%) Spring Boot
7 4 (2.08%) Symfony
7 4 (2.08%) Web Services
8 3 (1.56%) Django
8 3 (1.56%) JPA
8 3 (1.56%) PySpark
8 3 (1.56%) RESTful
Miscellaneous
1 19 (9.90%) Data Structures
2 13 (6.77%) Cloud Native
3 10 (5.21%) Management Information System
4 7 (3.65%) Virtual Team
5 6 (3.13%) Analytical Mindset
5 6 (3.13%) Hybrid Cloud
6 4 (2.08%) e-Learning
6 4 (2.08%) Enterprise Software
6 4 (2.08%) Product Ownership
7 3 (1.56%) Distributed Architecture
7 3 (1.56%) Low-Code
7 3 (1.56%) Onboarding
8 2 (1.04%) CMDB
8 2 (1.04%) Greenfield Project
8 2 (1.04%) Shadow IT
9 1 (0.52%) Algorithms
9 1 (0.52%) Credit Risk
9 1 (0.52%) Data Centre
9 1 (0.52%) Reinsurance
9 1 (0.52%) Self-Motivation
Operating Systems
1 3 (1.56%) Windows
1 3 (1.56%) Windows Server
2 1 (0.52%) Linux
2 1 (0.52%) Windows Server 2012
2 1 (0.52%) zOS
Processes & Methodologies
1 52 (27.08%) Agile
2 46 (23.96%) Stakeholder Management
3 44 (22.92%) OO
3 44 (22.92%) OOP
4 43 (22.40%) AI
4 43 (22.40%) Migration
5 38 (19.79%) Thought Leadership
6 32 (16.67%) CI/CD
7 31 (16.15%) IT Strategy
8 30 (15.63%) Computer Science
8 30 (15.63%) Machine Learning
9 29 (15.10%) DevOps
10 28 (14.58%) Roadmaps
11 27 (14.06%) LLM
12 26 (13.54%) Business Development
12 26 (13.54%) Prompt Engineering
13 25 (13.02%) Generative AI
13 25 (13.02%) MLOps
13 25 (13.02%) Problem-Solving
13 25 (13.02%) Retrieval-Augmented Generation
Programming Languages
1 44 (22.92%) Delphi
1 44 (22.92%) Pascal
2 29 (15.10%) SQL
3 18 (9.38%) Python
4 14 (7.29%) PHP
5 11 (5.73%) PowerShell
6 10 (5.21%) Java
7 7 (3.65%) JavaScript
8 4 (2.08%) C#
9 2 (1.04%) Data Analysis Expressions
9 2 (1.04%) PL/SQL
9 2 (1.04%) Shell Script
9 2 (1.04%) TypeScript
10 1 (0.52%) COBOL
10 1 (0.52%) Elixir
10 1 (0.52%) JCL
10 1 (0.52%) R
10 1 (0.52%) RPG
10 1 (0.52%) Rust
10 1 (0.52%) Scala
Qualifications
1 38 (19.79%) Degree
2 29 (15.10%) Computer Science Degree
3 7 (3.65%) Azure Certification
4 3 (1.56%) Security Cleared
5 2 (1.04%) Cisco Certification
5 2 (1.04%) SC Cleared
5 2 (1.04%) TOGAF Certification
6 1 (0.52%) (ISC)2 CCSP
6 1 (0.52%) ACCA
6 1 (0.52%) CCNP
6 1 (0.52%) CCSP
6 1 (0.52%) CISA
6 1 (0.52%) DBS Check
6 1 (0.52%) MCITP
6 1 (0.52%) MCSA
6 1 (0.52%) Microsoft Certification
6 1 (0.52%) SAP Certification
Quality Assurance & Compliance
1 46 (23.96%) QA
2 12 (6.25%) GDPR
3 3 (1.56%) Accessibility
4 2 (1.04%) Data Quality
4 2 (1.04%) ISO/IEC 27001
5 1 (0.52%) Cyber Essentials
5 1 (0.52%) Cyber Essentials PLUS
5 1 (0.52%) NIST
System Software
1 8 (4.17%) Docker
2 3 (1.56%) Active Directory
2 3 (1.56%) VMware ESXi
2 3 (1.56%) VMware Infrastructure
3 1 (0.52%) Hyper-V
3 1 (0.52%) Virtual Desktop
3 1 (0.52%) VMware Server
3 1 (0.52%) vSphere
Systems Management
1 14 (7.29%) Terraform
2 9 (4.69%) Kubernetes
3 3 (1.56%) Microsoft Intune
4 2 (1.04%) Prometheus
5 1 (0.52%) Ansible
5 1 (0.52%) Backup Exec
5 1 (0.52%) Cisco CUCM
5 1 (0.52%) FortiGate
5 1 (0.52%) Grafana
5 1 (0.52%) Kibana
5 1 (0.52%) SCOM
5 1 (0.52%) vCenter Server
5 1 (0.52%) ZABBIX
Vendors
1 51 (26.56%) Oracle
2 46 (23.96%) Microsoft
3 27 (14.06%) Google
4 13 (6.77%) Salesforce
5 8 (4.17%) Databricks
6 5 (2.60%) Cisco
6 5 (2.60%) VMware
7 4 (2.08%) Citrix
8 2 (1.04%) BiZZdesign
8 2 (1.04%) Meraki
8 2 (1.04%) MuleSoft
8 2 (1.04%) SAP
8 2 (1.04%) ServiceNow
8 2 (1.04%) SolarWinds
8 2 (1.04%) Sparx
8 2 (1.04%) Workday
9 1 (0.52%) Alteryx
9 1 (0.52%) Anaplan
9 1 (0.52%) Splunk
9 1 (0.52%) Veeam