Artificial Intelligence Jobs in London

Artificial Intelligence (AI)
England > London

The table below provides summary statistics for permanent job vacancies advertised in London requiring Artificial Intelligence skills. It includes a benchmarking guide to the annual salaries offered in vacancies that cited Artificial Intelligence over the 6 months leading up to 19 March 2025, comparing them to the same period in the previous two years.

6 months to
19 Mar 2025
Same period 2024 Same period 2023
Rank 35 58 117
Rank change year-on-year +23 +59 -50
Permanent jobs citing Artificial Intelligence 946 981 1,216
As % of all permanent jobs advertised in London 6.89% 4.44% 3.09%
As % of the Processes & Methodologies category 7.15% 4.84% 3.23%
Number of salaries quoted 503 646 663
10th Percentile £57,500 £52,500 £49,200
25th Percentile £73,750 £63,750 £62,500
Median annual salary (50th Percentile) £92,500 £85,000 £80,000
Median % change year-on-year +8.82% +6.25% -
75th Percentile £117,500 £110,000 £97,500
90th Percentile £145,000 £125,000 £115,000
England median annual salary £75,000 £70,000 £70,000
% change year-on-year +7.14% - +3.70%

All Process and Methodology Skills
London

Artificial Intelligence falls under the Processes and Methodologies category. For comparison with the information above, the following table provides summary statistics for all permanent job vacancies requiring process or methodology skills in London.

Permanent vacancies with a requirement for process or methodology skills 13,230 20,277 37,595
As % of all permanent jobs advertised in London 96.34% 91.72% 95.50%
Number of salaries quoted 7,571 15,869 26,696
10th Percentile £42,500 £38,750 £43,705
25th Percentile £56,250 £52,500 £55,000
Median annual salary (50th Percentile) £75,000 £72,500 £75,000
Median % change year-on-year +3.45% -3.33% +7.14%
75th Percentile £100,000 £95,000 £95,000
90th Percentile £122,500 £115,000 £115,000
England median annual salary £60,000 £55,000 £62,500
% change year-on-year +9.09% -12.00% +4.17%

Artificial Intelligence
Job Vacancy Trend in London

Job postings citing Artificial Intelligence as a proportion of all IT jobs advertised in London.
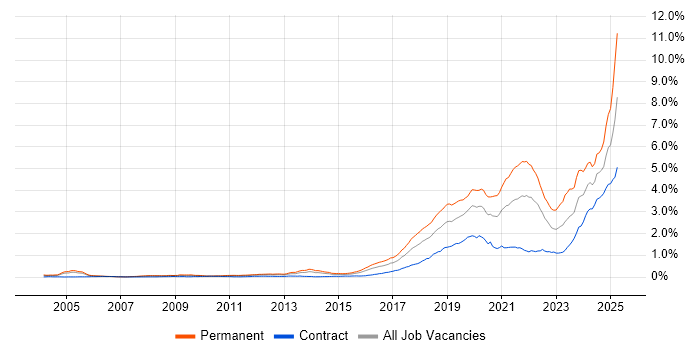
Job vacancy trend for Artificial Intelligence in London

Artificial Intelligence
Salary Trend in London

3-month moving average salary quoted in jobs citing Artificial Intelligence in London.

Salary trend for Artificial Intelligence in London

Artificial Intelligence
Salary Histogram in London

Salary distribution for jobs citing Artificial Intelligence in London over the 6 months to 19 March 2025.

Salary histogram for Artificial Intelligence in London

Artificial Intelligence
Job Locations in London

The table below looks at the demand and provides a guide to the median salaries quoted in IT jobs citing Artificial Intelligence within the London region over the 6 months to 19 March 2025. The 'Rank Change' column provides an indication of the change in demand within each location based on the same 6 month period last year.

Location Rank Change
on Same Period
Last Year
Matching
Permanent
IT Job Ads
Median Salary
Past 6 Months
Median Salary
% Change
on Same Period
Last Year
Live
Jobs
Central London +61 224 £102,500 +26.54% 86
South London +15 35 £75,000 +11.11% 8
West London +8 22 £100,000 +29.03% 37
East London -19 10 - - 19
North London -5 6 - - 3
Artificial Intelligence
England

Artificial Intelligence
Co-occurring Skills and Capabilities in London by Category

The follow tables expand on the table above by listing co-occurrences grouped by category. The same employment type, locality and period is covered with up to 20 co-occurrences shown in each of the following categories:

Application Platforms
1 19 (2.01%) Apache Spark
2 15 (1.59%) Apache Airflow
3 14 (1.48%) SharePoint
4 9 (0.95%) Jupyter
5 6 (0.63%) Apache
5 6 (0.63%) Kinematics
6 5 (0.53%) SAS
7 4 (0.42%) CMS
7 4 (0.42%) Confluence
8 3 (0.32%) Microsoft Exchange
9 2 (0.21%) nginx
9 2 (0.21%) WordPress
10 1 (0.11%) Camunda
10 1 (0.11%) Ethereum
10 1 (0.11%) Oracle Workflow
Applications
1 44 (4.65%) Chatbot
2 8 (0.85%) Maya
2 8 (0.85%) Microsoft Excel
3 5 (0.53%) Microsoft Office
4 4 (0.42%) SPSS
5 3 (0.32%) Microsoft PowerPoint
5 3 (0.32%) Trello
6 2 (0.21%) Autodesk Inventor
6 2 (0.21%) Blender
6 2 (0.21%) CATIA
6 2 (0.21%) MS Visio
6 2 (0.21%) SOLIDWORKS
7 1 (0.11%) Photoshop
7 1 (0.11%) Simulink
Business Applications
1 10 (1.06%) Dynamics AX
2 9 (0.95%) Elite 3E
3 4 (0.42%) Relativity
4 3 (0.32%) Dynamics CRM
5 2 (0.21%) Distributed Ledger
6 1 (0.11%) Finacle
6 1 (0.11%) Remedy ITSM
6 1 (0.11%) SAP FI
6 1 (0.11%) SAP LE
6 1 (0.11%) SAP S/4HANA
Cloud Services
1 222 (23.47%) AWS
2 204 (21.56%) Azure
3 105 (11.10%) GCP
4 69 (7.29%) Power Platform
5 55 (5.81%) SaaS
6 40 (4.23%) Serverless
7 26 (2.75%) Cloud Computing
7 26 (2.75%) Snowflake
8 23 (2.43%) GitHub
9 22 (2.33%) Microsoft 365
10 21 (2.22%) Azure Synapse Analytics
10 21 (2.22%) dbt
11 20 (2.11%) ChatGPT
12 16 (1.69%) Microsoft Copilot
13 14 (1.48%) AWS Lambda
13 14 (1.48%) Azure Functions
14 13 (1.37%) Azure AI
14 13 (1.37%) PaaS
15 12 (1.27%) Figma
15 12 (1.27%) Microsoft Purview
Communications & Networking
1 64 (6.77%) Intrusion Detection
2 18 (1.90%) Broadband
3 9 (0.95%) TCP/IP
4 7 (0.74%) DNS
4 7 (0.74%) Internet
4 7 (0.74%) VPN
4 7 (0.74%) WAN
5 6 (0.63%) LAN
6 5 (0.53%) DHCP
6 5 (0.53%) Firewall
7 4 (0.42%) BGP
7 4 (0.42%) VoIP
8 3 (0.32%) MPLS
8 3 (0.32%) OSPF
8 3 (0.32%) Unified Communications
9 2 (0.21%) NAS
10 1 (0.11%) Network Security
10 1 (0.11%) SAN
10 1 (0.11%) SSH
10 1 (0.11%) VLAN
Database & Business Intelligence
1 63 (6.66%) Power BI
2 45 (4.76%) Big Data
3 35 (3.70%) Data Warehouse
4 33 (3.49%) NoSQL
5 30 (3.17%) Tableau
6 18 (1.90%) BigQuery
7 13 (1.37%) Metadata
8 12 (1.27%) Amazon RDS
8 12 (1.27%) Amazon Redshift
8 12 (1.27%) Data Lake
8 12 (1.27%) Hadoop
8 12 (1.27%) PostgreSQL
9 11 (1.16%) Neo4j
10 10 (1.06%) MySQL
11 9 (0.95%) Data Hub
11 9 (0.95%) MongoDB
11 9 (0.95%) Relational Database
11 9 (0.95%) SQL Server
12 8 (0.85%) Amazon Aurora
12 8 (0.85%) Data Vault
Development Applications
1 41 (4.33%) Git
2 16 (1.69%) JIRA
3 10 (1.06%) GitLab
4 8 (0.85%) Jenkins
5 6 (0.63%) Terragrunt
6 4 (0.42%) MLflow
7 3 (0.32%) JUnit
7 3 (0.32%) Maven
8 2 (0.21%) CircleCI
8 2 (0.21%) Cucumber
8 2 (0.21%) Cypress.io
9 1 (0.11%) Artifactory
9 1 (0.11%) Atlassian Bamboo
9 1 (0.11%) Bitbucket
9 1 (0.11%) Octopus Deploy
9 1 (0.11%) Selenium
9 1 (0.11%) SonarQube
9 1 (0.11%) SpecFlow
9 1 (0.11%) TeamCity
9 1 (0.11%) TestNG
General
1 333 (35.20%) Social Skills
2 264 (27.91%) Finance
3 183 (19.34%) Analytical Skills
4 107 (11.31%) Telecoms
5 90 (9.51%) Marketing
6 89 (9.41%) Inclusion and Diversity
7 86 (9.09%) Law
8 63 (6.66%) Legal
9 59 (6.24%) Banking
10 43 (4.55%) Advertising
10 43 (4.55%) Games
11 39 (4.12%) Retail
12 38 (4.02%) Manufacturing
13 34 (3.59%) Front Office
14 33 (3.49%) Publishing
15 31 (3.28%) Public Sector
16 24 (2.54%) Influencing Skills
17 23 (2.43%) Presentation Skills
18 18 (1.90%) Organisational Skills
19 9 (0.95%) Financial Institution
Job Titles
1 168 (17.76%) Senior
2 149 (15.75%) Architect
3 109 (11.52%) Lead
4 63 (6.66%) Security Architect
5 62 (6.55%) Product Manager
6 61 (6.45%) Analyst
7 47 (4.97%) Data Engineer
8 45 (4.76%) Software Engineer
9 41 (4.33%) Business Analyst
10 39 (4.12%) Solutions Architect
11 38 (4.02%) Senior Manager
12 35 (3.70%) Business Manager
12 35 (3.70%) Data Scientist
13 34 (3.59%) Developer
14 33 (3.49%) Consultant
14 33 (3.49%) Product Analyst
14 33 (3.49%) Product Business Analyst
15 23 (2.43%) Artificial Intelligence Engineer
16 22 (2.33%) Full-Stack Engineer
16 22 (2.33%) Senior Data Scientist
Libraries, Frameworks & Software Standards
1 80 (8.46%) HTML
2 77 (8.14%) React
3 48 (5.07%) PyTorch
4 45 (4.76%) TensorFlow
5 40 (4.23%) Pandas
6 29 (3.07%) NumPy
6 29 (3.07%) scikit-learn
7 27 (2.85%) Next.js
8 25 (2.64%) REST
9 23 (2.43%) CSS
9 23 (2.43%) Kafka
10 20 (2.11%) SciPy
11 19 (2.01%) OpenCV
12 18 (1.90%) .NET
12 18 (1.90%) RESTful
13 17 (1.80%) Django
14 14 (1.48%) AngularJS
15 13 (1.37%) Middleware
15 13 (1.37%) Node.js
15 13 (1.37%) SpaCy
Miscellaneous
1 95 (10.04%) Management Information System
2 78 (8.25%) Robotics
3 66 (6.98%) Cyberattack
4 64 (6.77%) Algorithms
5 53 (5.60%) Product Ownership
6 50 (5.29%) Blockchain
7 39 (4.12%) Hedge funds
8 33 (3.49%) Derivative
8 33 (3.49%) Equities
8 33 (3.49%) Fixed Income
8 33 (3.49%) Foreign Exchange (FX)
9 24 (2.54%) Cloud Native
10 23 (2.43%) Onboarding
11 22 (2.33%) Digital Media
11 22 (2.33%) Enterprise Software
12 21 (2.22%) Marketing Technology
12 21 (2.22%) Self-Motivation
13 20 (2.11%) Virtual Team
14 16 (1.69%) Analytical Mindset
15 15 (1.59%) Video\Live Streaming
Operating Systems
1 36 (3.81%) Apple iOS
2 13 (1.37%) Windows
3 11 (1.16%) Linux
4 9 (0.95%) Robot Operating System
5 7 (0.74%) Windows Server
6 6 (0.63%) Android
7 5 (0.53%) Windows Server 2019
8 4 (0.42%) Windows Server 2012
8 4 (0.42%) Windows Server 2016
9 1 (0.11%) Unix
Processes & Methodologies
1 375 (39.64%) Machine Learning
2 288 (30.44%) Analytics
3 243 (25.69%) Agile
4 226 (23.89%) Problem-Solving
5 169 (17.86%) Mentoring
6 161 (17.02%) Data Science
7 160 (16.91%) Roadmaps
8 138 (14.59%) Generative AI
9 116 (12.26%) Cybersecurity
10 110 (11.63%) Decision-Making
11 108 (11.42%) Computer Science
12 107 (11.31%) Risk Management
13 105 (11.10%) LLM
14 101 (10.68%) DevOps
14 101 (10.68%) Project Management
15 100 (10.57%) Creative Thinking
16 95 (10.04%) Information Security
17 88 (9.30%) Business Intelligence
18 87 (9.20%) Data Analytics
18 87 (9.20%) Software Engineering
Programming Languages
1 354 (37.42%) Python
2 130 (13.74%) SQL
3 56 (5.92%) TypeScript
4 55 (5.81%) Java
5 46 (4.86%) JavaScript
6 26 (2.75%) C#
7 24 (2.54%) C++
7 24 (2.54%) R
8 18 (1.90%) Scala
9 15 (1.59%) Bash
10 14 (1.48%) MATLAB
11 12 (1.27%) Go
11 12 (1.27%) PowerShell
12 6 (0.63%) C
13 5 (0.53%) Data Analysis Expressions
13 5 (0.53%) Kotlin
14 4 (0.42%) Bicep
14 4 (0.42%) Perl
14 4 (0.42%) PHP
14 4 (0.42%) VB.NET
Qualifications
1 232 (24.52%) Degree
2 96 (10.15%) Security Cleared
3 95 (10.04%) Master's Degree
4 74 (7.82%) DV Cleared
5 65 (6.87%) PhD
6 57 (6.03%) Computer Science Degree
7 27 (2.85%) Azure Certification
8 20 (2.11%) SC Cleared
9 18 (1.90%) AWS Certification
10 12 (1.27%) CISA
11 11 (1.16%) DBS Check
11 11 (1.16%) MBA
12 10 (1.06%) ISACA
13 9 (0.95%) Microsoft Certification
13 9 (0.95%) Numerate Degree
14 7 (0.74%) AWS Certified Cloud Practitioner
15 6 (0.63%) Cisco Certification
16 5 (0.53%) CCNA
17 4 (0.42%) MCSE
17 4 (0.42%) Postgraduate
Quality Assurance & Compliance
1 36 (3.81%) Data Quality
2 23 (2.43%) GDPR
3 22 (2.33%) ITGC
4 21 (2.22%) Accessibility
5 13 (1.37%) QA
6 11 (1.16%) ISO/IEC 27001
7 7 (0.74%) California Consumer Privacy Act
8 6 (0.63%) SLA
9 5 (0.53%) NIST
10 3 (0.32%) Cyber Essentials
10 3 (0.32%) NCSC
10 3 (0.32%) PCI DSS
11 2 (0.21%) COBIT
11 2 (0.21%) MiFID
11 2 (0.21%) PMO
11 2 (0.21%) SOC 2
12 1 (0.11%) HIPAA
12 1 (0.11%) PSD2
12 1 (0.11%) Sarbanes-Oxley
12 1 (0.11%) SOC 1
System Software
1 60 (6.34%) Docker
2 15 (1.59%) Active Directory
3 6 (0.63%) VMware Infrastructure
4 5 (0.53%) Hyper-V
5 3 (0.32%) Virtual Machines
6 2 (0.21%) HDFS
7 1 (0.11%) Apache Flume
7 1 (0.11%) XenApp
7 1 (0.11%) XenDesktop
Systems Management
1 69 (7.29%) Kubernetes
2 50 (5.29%) Terraform
3 13 (1.37%) Prometheus
4 11 (1.16%) Grafana
5 8 (0.85%) Ansible
6 7 (0.74%) Microsoft Intune
7 6 (0.63%) SCCM
8 4 (0.42%) Kubeflow
8 4 (0.42%) NetBackup
8 4 (0.42%) SCOM
9 3 (0.32%) Nagios
10 2 (0.21%) Progress Chef
10 2 (0.21%) Puppet
11 1 (0.11%) Argo
11 1 (0.11%) Bugsnag
11 1 (0.11%) DameWare
11 1 (0.11%) Istio
11 1 (0.11%) Kibana
11 1 (0.11%) Single Sign-On
Vendors
1 81 (8.56%) Microsoft
2 65 (6.87%) Databricks
3 51 (5.39%) Google
4 37 (3.91%) SAP
5 23 (2.43%) ServiceNow
6 22 (2.33%) OpenAI
7 21 (2.22%) Oracle
8 20 (2.11%) Salesforce
9 11 (1.16%) IBM
10 8 (0.85%) Informatica
10 8 (0.85%) Red Hat
11 7 (0.74%) Genesys
11 7 (0.74%) SolarWinds
12 6 (0.63%) MicroStrategy
12 6 (0.63%) VMware
12 6 (0.63%) Workday
13 5 (0.53%) Cisco
14 4 (0.42%) Adobe
14 4 (0.42%) Avaya
14 4 (0.42%) Veeam