Azure Engineer Jobs in London

Microsoft Azure Engineer
England > London

The median Microsoft Azure Engineer salary in London is £75,000 per year, according to job vacancies posted during the 6 months leading to 26 July 2024.

The table below provides salary benchmarking and summary statistics, comparing them to the same period in the previous two years.

6 months to
26 Jul 2024
Same period 2023 Same period 2022
Rank 214 235 406
Rank change year-on-year +21 +171 -144
Permanent jobs requiring an Azure Engineer 316 401 713
As % of all permanent jobs advertised in London 1.52% 1.48% 0.95%
As % of the Job Titles category 1.61% 1.55% 0.99%
Number of salaries quoted 264 359 571
10th Percentile £52,500 £47,250 £50,000
25th Percentile £62,500 £60,000 £62,500
Median annual salary (50th Percentile) £75,000 £75,000 £75,000
Median % change year-on-year - - +7.14%
75th Percentile £95,625 £87,500 £88,750
90th Percentile £107,500 £100,000 £98,750
England median annual salary £65,000 £67,500 £67,500
% change year-on-year -3.70% - +12.50%

All Permanent IT Job Vacancies
London

For comparison with the information above, the following table provides summary statistics for all permanent IT job vacancies in London. Most job vacancies include a discernible job title that can be normalized. As such, the figures in the second row provide an indication of the number of permanent jobs in our overall sample.

Permanent vacancies in London with a recognized job title 19,628 25,813 71,873
% of permanent jobs with a recognized job title 94.64% 95.17% 95.81%
Number of salaries quoted 13,829 20,517 35,752
10th Percentile £38,500 £41,250 £41,250
25th Percentile £50,000 £53,750 £52,500
Median annual salary (50th Percentile) £70,000 £72,500 £70,000
Median % change year-on-year -3.45% +3.57% -
75th Percentile £95,000 £95,000 £91,250
90th Percentile £117,500 £115,000 £110,000
England median annual salary £55,000 £60,000 £60,000
% change year-on-year -8.33% - +9.09%

Azure Engineer
Job Vacancy Trend in London

Job postings that featured Azure Engineer in the job title as a proportion of all IT jobs advertised in London.
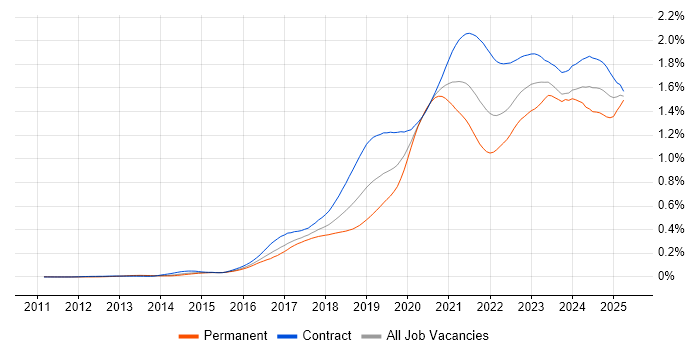
Job vacancy trend for Azure Engineer in London

Azure Engineer
Salary Trend in London

3-month moving average salary quoted in jobs citing Azure Engineer in London.

Salary trend for Azure Engineer in London

Azure Engineer
Salary Histogram in London

Salary distribution for jobs citing Azure Engineer in London over the 6 months to 26 July 2024.

Salary histogram for Azure Engineer in London

Azure Engineer
Job Locations in London

The table below looks at the demand and provides a guide to the median salaries quoted in IT jobs citing Azure Engineer within the London region over the 6 months to 26 July 2024. The 'Rank Change' column provides an indication of the change in demand within each location based on the same 6 month period last year.

Location Rank Change
on Same Period
Last Year
Matching
Permanent
IT Job Ads
Median Salary
Past 6 Months
Median Salary
% Change
on Same Period
Last Year
Live
Jobs
Central London +19 68 £70,000 +3.32% 11
South London -10 6 £65,000 +8.33%
West London -8 5 £70,000 -0.18%
Azure Engineer
England

Azure Engineer Skill Set
Top 30 Co-occurring Skills and Capabilities in London

For the 6 months to 26 July 2024, Azure Engineer job roles required the following skills and capabilities in order of popularity. The figures indicate the absolute number co-occurrences and as a proportion of all permanent job ads across the London region featuring Azure Engineer in the job title.

1 316 (100.00%) Azure
2 139 (43.99%) DevOps
3 115 (36.39%) Microsoft
4 114 (36.08%) PowerShell
5 113 (35.76%) Terraform
6 110 (34.81%) Python
7 109 (34.49%) SQL
8 104 (32.91%) Finance
9 96 (30.38%) CI/CD
10 84 (26.58%) Azure DevOps
11 75 (23.73%) Kubernetes
12 66 (20.89%) Windows
13 65 (20.57%) Business Intelligence
14 62 (19.62%) Platform Engineering
15 61 (19.30%) Azure Data Factory
16 60 (18.99%) Databricks
17 59 (18.67%) Agile
18 57 (18.04%) Infrastructure as Code
19 56 (17.72%) Azure SQL Database
19 56 (17.72%) Active Directory
20 55 (17.41%) Social Skills
21 53 (16.77%) Azure Synapse Analytics
22 52 (16.46%) Inclusion and Diversity
23 51 (16.14%) Analytics
24 47 (14.87%) Problem-Solving
25 46 (14.56%) Docker
26 44 (13.92%) Ansible
26 44 (13.92%) ETL
26 44 (13.92%) Firewall
27 43 (13.61%) Bash

Azure Engineer Skill Set
Co-occurring Skills and Capabilities in London by Category

The follow tables expand on the table above by listing co-occurrences grouped by category. The same employment type, locality and period is covered with up to 20 co-occurrences shown in each of the following categories:

Application Platforms
1 12 (3.80%) SharePoint
2 10 (3.16%) Microsoft Exchange
3 6 (1.90%) IIS
4 5 (1.58%) Tomcat
5 4 (1.27%) Apache
6 3 (0.95%) Apache Spark
7 2 (0.63%) Confluence
8 1 (0.32%) BizTalk Server
8 1 (0.32%) CMS
8 1 (0.32%) WordPress
Applications
1 10 (3.16%) Microsoft Office
2 5 (1.58%) Microsoft Excel
3 4 (1.27%) MS Visio
Business Applications
1 11 (3.48%) Remedy ITSM
Cloud Services
1 316 (100.00%) Azure
2 84 (26.58%) Azure DevOps
3 61 (19.30%) Azure Data Factory
4 53 (16.77%) Azure Synapse Analytics
5 43 (13.61%) Entra ID
5 43 (13.61%) Power Platform
6 37 (11.71%) PaaS
7 35 (11.08%) Microsoft 365
8 34 (10.76%) GitHub
9 28 (8.86%) Azure AKS
10 19 (6.01%) Azure Monitor
10 19 (6.01%) SaaS
11 17 (5.38%) Azure Cosmos DB
12 15 (4.75%) IaaS
13 14 (4.43%) AWS
13 14 (4.43%) Azure Key Vault
13 14 (4.43%) Azure Storage
13 14 (4.43%) Serverless
14 10 (3.16%) Azure Logic Apps
15 9 (2.85%) Azure Data Lake Analytics
Communications & Networking
1 44 (13.92%) Firewall
2 31 (9.81%) DNS
3 23 (7.28%) Network Security
4 17 (5.38%) WAN
5 14 (4.43%) SD-WAN
5 14 (4.43%) VPN
6 6 (1.90%) DHCP
6 6 (1.90%) Wireless
7 5 (1.58%) BGP
7 5 (1.58%) SSL
8 4 (1.27%) HSRP
8 4 (1.27%) OSPF
8 4 (1.27%) TCP/IP
8 4 (1.27%) Unified Communications
8 4 (1.27%) Wi-Fi
9 3 (0.95%) LAN
10 1 (0.32%) IPv4
10 1 (0.32%) SAN
10 1 (0.32%) VoIP
10 1 (0.32%) WLAN
Database & Business Intelligence
1 56 (17.72%) Azure SQL Database
2 43 (13.61%) Power BI
3 34 (10.76%) Data Warehouse
4 33 (10.44%) Data Lake
5 18 (5.70%) SQL Server
6 10 (3.16%) NoSQL
7 9 (2.85%) Delta Lake
7 9 (2.85%) Microsoft Analysis Services
8 8 (2.53%) MongoDB
8 8 (2.53%) PostgreSQL
9 7 (2.22%) SQL Server Integration Services
10 6 (1.90%) Redis
10 6 (1.90%) SQL Server Analysis Services
11 5 (1.58%) MariaDB
11 5 (1.58%) MySQL
11 5 (1.58%) SQL Server Reporting Services
12 2 (0.63%) Big Data
12 2 (0.63%) Relational Database
12 2 (0.63%) Spark SQL
13 1 (0.32%) Qlik Sense
Development Applications
1 17 (5.38%) Git
2 15 (4.75%) Octopus Deploy
3 13 (4.11%) Jenkins
4 10 (3.16%) GitLab
5 7 (2.22%) Katalon Studio
6 4 (1.27%) JIRA
7 3 (0.95%) Bitbucket
7 3 (0.95%) Maven
8 1 (0.32%) CircleCI
General
1 104 (32.91%) Finance
2 55 (17.41%) Social Skills
3 52 (16.46%) Inclusion and Diversity
4 18 (5.70%) Analytical Skills
5 12 (3.80%) Law
6 10 (3.16%) Presentation Skills
7 9 (2.85%) Documentation Skills
8 8 (2.53%) Influencing Skills
8 8 (2.53%) Manufacturing
9 6 (1.90%) Banking
9 6 (1.90%) Public Sector
10 4 (1.27%) Legal
11 3 (0.95%) Health Technology
11 3 (0.95%) Marketing
11 3 (0.95%) Telecoms
12 2 (0.63%) Electronics
13 1 (0.32%) Billing
13 1 (0.32%) Games
13 1 (0.32%) Local Government
13 1 (0.32%) Retail
Libraries, Frameworks & Software Standards
1 38 (12.03%) PySpark
2 17 (5.38%) ARM Templates
3 15 (4.75%) YAML
4 12 (3.80%) Elastic Stack
5 7 (2.22%) .NET
5 7 (2.22%) React
6 6 (1.90%) Loki
6 6 (1.90%) SAML
7 4 (1.27%) OAuth
7 4 (1.27%) RESTful
8 3 (0.95%) ASP.NET
8 3 (0.95%) ASP.NET Web API
8 3 (0.95%) CSS
8 3 (0.95%) HTML
8 3 (0.95%) REST
8 3 (0.95%) SOAP
9 2 (0.63%) JSON
9 2 (0.63%) Web Services
10 1 (0.32%) SailPoint
10 1 (0.32%) SignalR
Miscellaneous
1 27 (8.54%) Cloud Native
2 23 (7.28%) Linux Command Line
3 14 (4.43%) Private Cloud
3 14 (4.43%) Public Cloud
4 11 (3.48%) Cyber Threat
4 11 (3.48%) Enterprise Software
5 10 (3.16%) Distributed Systems
5 10 (3.16%) Security Posture
6 9 (2.85%) Greenfield Project
7 8 (2.53%) Management Information System
8 7 (2.22%) Cloud Security Posture
8 7 (2.22%) Data Centre
8 7 (2.22%) Enterprise Cloud
9 5 (1.58%) Taxonomies
10 4 (1.27%) Self-Motivation
11 3 (0.95%) Replication
11 3 (0.95%) Tandem
12 2 (0.63%) iPhone
12 2 (0.63%) Product Ownership
12 2 (0.63%) Smartphone
Operating Systems
1 66 (20.89%) Windows
2 36 (11.39%) Linux
3 30 (9.49%) Windows Server
4 9 (2.85%) Windows 10
5 6 (1.90%) Windows Server 2016
6 5 (1.58%) Red Hat Enterprise Linux
7 3 (0.95%) Mac OS
8 2 (0.63%) VMS
8 2 (0.63%) Windows Server 2019
9 1 (0.32%) CoreOS
9 1 (0.32%) Ubuntu
9 1 (0.32%) Windows Server 2008
9 1 (0.32%) Windows Server 2012
Processes & Methodologies
1 139 (43.99%) DevOps
2 96 (30.38%) CI/CD
3 65 (20.57%) Business Intelligence
4 62 (19.62%) Platform Engineering
5 59 (18.67%) Agile
6 57 (18.04%) Infrastructure as Code
7 51 (16.14%) Analytics
8 47 (14.87%) Problem-Solving
9 44 (13.92%) ETL
10 34 (10.76%) Infrastructure Engineering
11 32 (10.13%) Containerisation
12 31 (9.81%) DevSecOps
13 29 (9.18%) Data Engineering
13 29 (9.18%) Data Pipeline
14 26 (8.23%) Cloud Security
15 25 (7.91%) Scrum
16 24 (7.59%) Configuration Management
16 24 (7.59%) Migration
17 23 (7.28%) Continuous Improvement
18 22 (6.96%) Microservices
Programming Languages
1 114 (36.08%) PowerShell
2 110 (34.81%) Python
3 109 (34.49%) SQL
4 43 (13.61%) Bash
5 14 (4.43%) Java
6 11 (3.48%) C#
7 9 (2.85%) Data Analysis Expressions
7 9 (2.85%) U-SQL
8 4 (1.27%) Go
8 4 (1.27%) JavaScript
9 2 (0.63%) Scala
9 2 (0.63%) TypeScript
10 1 (0.32%) Bicep
10 1 (0.32%) C++
Qualifications
1 41 (12.97%) Azure Certification
2 21 (6.65%) Degree
3 17 (5.38%) Microsoft Certification
4 15 (4.75%) Security Cleared
5 13 (4.11%) Computer Science Degree
6 8 (2.53%) CISSP
7 7 (2.22%) Cisco Certification
8 6 (1.90%) (ISC)2 CCSP
8 6 (1.90%) CCSP
9 4 (1.27%) AWS Certification
10 3 (0.95%) ITIL Certification
10 3 (0.95%) SC Cleared
11 1 (0.32%) AWS Certified DevOps Engineer
11 1 (0.32%) AWS Certified Solutions Architect
11 1 (0.32%) CCNA
11 1 (0.32%) CEH
Quality Assurance & Compliance
1 17 (5.38%) Data Quality
2 11 (3.48%) SOC 2
3 10 (3.16%) GDPR
4 8 (2.53%) ISO/IEC 27001
4 8 (2.53%) NIST
5 7 (2.22%) HIPAA
6 3 (0.95%) Accessibility
7 2 (0.63%) QA
8 1 (0.32%) Cyber Essentials
8 1 (0.32%) PCI DSS
8 1 (0.32%) SLA
System Software
1 56 (17.72%) Active Directory
2 46 (14.56%) Docker
3 8 (2.53%) Virtual Machines
4 7 (2.22%) VMware Infrastructure
5 4 (1.27%) Hyper-V
5 4 (1.27%) XenApp
5 4 (1.27%) XenDesktop
6 2 (0.63%) Virtual Desktop
6 2 (0.63%) vSphere
Systems Management
1 113 (35.76%) Terraform
2 75 (23.73%) Kubernetes
3 44 (13.92%) Ansible
4 11 (3.48%) Microsoft Intune
5 10 (3.16%) Active Directory Federation Services
6 9 (2.85%) Prometheus
7 6 (1.90%) Grafana
7 6 (1.90%) Progress Chef
8 5 (1.58%) Pingdom
9 4 (1.27%) FortiGate
9 4 (1.27%) Puppet
10 3 (0.95%) McAfee ePO
10 3 (0.95%) Packer
10 3 (0.95%) SCCM
10 3 (0.95%) Single Sign-On
11 2 (0.63%) CASB
12 1 (0.32%) Rancher
12 1 (0.32%) SCOM
12 1 (0.32%) yum
Vendors
1 115 (36.39%) Microsoft
2 60 (18.99%) Databricks
3 15 (4.75%) Remedy
3 15 (4.75%) SolarWinds
4 12 (3.80%) Cisco
5 11 (3.48%) BMC
5 11 (3.48%) Oracle
6 9 (2.85%) VMware
7 7 (2.22%) Palo Alto
8 6 (1.90%) Meraki
8 6 (1.90%) Splunk
9 5 (1.58%) Citrix
9 5 (1.58%) Zscaler
10 4 (1.27%) New Relic
11 3 (0.95%) ForgeRock
11 3 (0.95%) McAfee
12 2 (0.63%) Atlassian
12 2 (0.63%) Google
12 2 (0.63%) Red Hat
12 2 (0.63%) SAP