Coaching Jobs in London

Coaching
England > London

The table below provides summary statistics for permanent job vacancies advertised in London requiring Coaching skills. It includes a benchmarking guide to the annual salaries offered in vacancies that cited Coaching over the 6 months leading up to 30 May 2025, comparing them to the same period in the previous two years.

6 months to
30 May 2025
Same period 2024 Same period 2023
Rank 64 87 89
Rank change year-on-year +23 +2 -40
Permanent jobs citing Coaching 564 813 1,141
As % of all permanent jobs advertised in London 4.44% 3.39% 3.48%
As % of the Processes & Methodologies category 4.62% 3.75% 3.65%
Number of salaries quoted 163 441 573
10th Percentile £45,064 £36,500 £48,800
25th Percentile £58,750 £51,250 £60,255
Median annual salary (50th Percentile) £71,000 £68,000 £81,723
Median % change year-on-year +4.41% -16.79% +8.96%
75th Percentile £100,000 £87,500 £97,500
90th Percentile £124,000 £105,000 £127,500
England median annual salary £54,793 £60,000 £67,500
% change year-on-year -8.68% -11.11% -1.03%

All Process and Methodology Skills
London

Coaching falls under the Processes and Methodologies category. For comparison with the information above, the following table provides summary statistics for all permanent job vacancies requiring process or methodology skills in London.

Permanent vacancies with a requirement for process or methodology skills 12,216 21,652 31,243
As % of all permanent jobs advertised in London 96.26% 90.32% 95.32%
Number of salaries quoted 6,929 15,871 22,511
10th Percentile £41,700 £37,500 £42,789
25th Percentile £55,500 £51,250 £55,000
Median annual salary (50th Percentile) £75,000 £70,000 £75,000
Median % change year-on-year +7.14% -6.67% +7.14%
75th Percentile £100,000 £95,000 £95,000
90th Percentile £122,500 £115,000 £115,055
England median annual salary £57,500 £55,000 £62,500
% change year-on-year +4.55% -12.00% +4.17%

Coaching
Job Vacancy Trend in London

Job postings citing Coaching as a proportion of all IT jobs advertised in London.
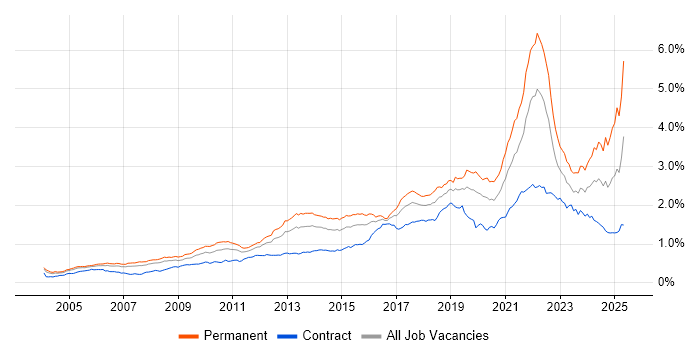
Job vacancy trend for Coaching in London

Coaching
Salary Trend in London

3-month moving average salary quoted in jobs citing Coaching in London.

Salary trend for Coaching in London

Coaching
Salary Histogram in London

Salary distribution for jobs citing Coaching in London over the 6 months to 30 May 2025.

Salary histogram for Coaching in London

Coaching
Job Locations in London

The table below looks at the demand and provides a guide to the median salaries quoted in IT jobs citing Coaching within the London region over the 6 months to 30 May 2025. The 'Rank Change' column provides an indication of the change in demand within each location based on the same 6 month period last year.

Location Rank Change
on Same Period
Last Year
Matching
Permanent
IT Job Ads
Median Salary
Past 6 Months
Median Salary
% Change
on Same Period
Last Year
Live
Jobs
Central London +68 143 £66,750 +6.80% 49
South London +9 42 £65,000 +13.04% 7
East London 0 18 £100,000 +143.90% 11
West London +25 16 - - 94
North London -7 7 - - 3
Coaching
England

Coaching
Co-occurring Skills and Capabilities in London by Category

The follow tables expand on the table above by listing co-occurrences grouped by category. The same employment type, locality and period is covered with up to 20 co-occurrences shown in each of the following categories:

Application Platforms
1 14 (2.48%) SharePoint
2 12 (2.13%) Microsoft Exchange
3 6 (1.06%) Confluence
3 6 (1.06%) Moodle
4 5 (0.89%) CMS
5 2 (0.35%) Adobe Experience Manager
5 2 (0.35%) Apache Airflow
5 2 (0.35%) nginx
6 1 (0.18%) Luigi
6 1 (0.18%) SAS
Applications
1 26 (4.61%) Microsoft Excel
2 20 (3.55%) Microsoft PowerPoint
3 17 (3.01%) Microsoft Office
4 6 (1.06%) Microsoft Project
5 2 (0.35%) Adobe Creative Suite
5 2 (0.35%) Trello
6 1 (0.18%) MS Visio
6 1 (0.18%) Stata
Business Applications
1 12 (2.13%) Dynamics AX
2 5 (0.89%) Adobe Campaign
3 4 (0.71%) CA PPM
3 4 (0.71%) Relativity
3 4 (0.71%) Ringtail
3 4 (0.71%) Veritas eDiscovery
4 3 (0.53%) Dynamics CRM
5 2 (0.35%) NEC Housing
5 2 (0.35%) SAP Hybris
6 1 (0.18%) Actimize
6 1 (0.18%) Endur
Cloud Services
1 76 (13.48%) Azure
2 69 (12.23%) AWS
3 29 (5.14%) GCP
4 25 (4.43%) Power Platform
5 24 (4.26%) SaaS
6 22 (3.90%) Microsoft 365
7 19 (3.37%) GitHub
8 14 (2.48%) Azure DevOps
9 13 (2.30%) GitHub Actions
10 12 (2.13%) Cloud Computing
10 12 (2.13%) PaaS
11 10 (1.77%) Serverless
12 7 (1.24%) IaaS
13 6 (1.06%) Adobe Analytics
13 6 (1.06%) Azure Data Factory
13 6 (1.06%) Azure Synapse Analytics
13 6 (1.06%) Contentful
14 5 (0.89%) Azure AI
14 5 (0.89%) Azure Machine Learning
15 4 (0.71%) AWS Lambda
Communications & Networking
1 67 (11.88%) Broadband
2 10 (1.77%) Firewall
3 5 (0.89%) DNS
3 5 (0.89%) Wireless
4 4 (0.71%) 5G
4 4 (0.71%) Bluetooth
4 4 (0.71%) GSM
4 4 (0.71%) LTE
4 4 (0.71%) UMTS
4 4 (0.71%) Wi-Fi
5 3 (0.53%) Intranet
5 3 (0.53%) Network Security
5 3 (0.53%) TCP/IP
5 3 (0.53%) VoIP
5 3 (0.53%) WAN
6 2 (0.35%) BGP
6 2 (0.35%) Internet
6 2 (0.35%) MPLS
6 2 (0.35%) OSPF
6 2 (0.35%) VPN
Database & Business Intelligence
1 22 (3.90%) Power BI
2 15 (2.66%) SQL Server
3 12 (2.13%) MongoDB
3 12 (2.13%) PostgreSQL
4 11 (1.95%) DB2
4 11 (1.95%) NoSQL
5 7 (1.24%) Relational Database
6 6 (1.06%) Tableau
7 5 (0.89%) MySQL
8 4 (0.71%) Data Warehouse
8 4 (0.71%) EDRMS
8 4 (0.71%) Power Query
8 4 (0.71%) PowerPivot
9 3 (0.53%) SQL Server Integration Services
10 2 (0.35%) Looker
11 1 (0.18%) Apache Cassandra
11 1 (0.18%) Big Data
11 1 (0.18%) Hadoop
11 1 (0.18%) Hazelcast
11 1 (0.18%) InterSystems Cache
Development Applications
1 21 (3.72%) JIRA
2 12 (2.13%) Git
3 10 (1.77%) Jenkins
4 8 (1.42%) SonarQube
5 7 (1.24%) Gradle
6 6 (1.06%) Grunt
6 6 (1.06%) Jasmine
6 6 (1.06%) Mocha
6 6 (1.06%) webpack
7 5 (0.89%) GitLab
8 3 (0.53%) Cucumber
8 3 (0.53%) Postman
8 3 (0.53%) Selenium
8 3 (0.53%) TeamCity
9 2 (0.35%) Octopus Deploy
9 2 (0.35%) SoapUI
10 1 (0.18%) Appium
10 1 (0.18%) Artifactory
10 1 (0.18%) Vagrant
10 1 (0.18%) XCUITest
General
1 276 (48.94%) Social Skills
2 198 (35.11%) Finance
3 104 (18.44%) Inclusion and Diversity
4 99 (17.55%) Analytical Skills
5 73 (12.94%) Retail
6 58 (10.28%) Banking
7 48 (8.51%) Marketing
8 43 (7.62%) Public Sector
9 32 (5.67%) Telecoms
10 31 (5.50%) Games
11 28 (4.96%) Law
12 27 (4.79%) Influencing Skills
13 23 (4.08%) Manufacturing
13 23 (4.08%) Presentation Skills
14 22 (3.90%) Legal
15 15 (2.66%) Retail Banking
16 12 (2.13%) Organisational Skills
17 6 (1.06%) Financial Institution
18 5 (0.89%) Advertising
18 5 (0.89%) Local Government
Job Titles
1 118 (20.92%) Senior
2 82 (14.54%) Lead
3 67 (11.88%) Support Engineer
4 36 (6.38%) Developer
5 28 (4.96%) Architect
6 24 (4.26%) Solutions Architect
7 20 (3.55%) Senior Manager
8 19 (3.37%) Analyst
8 19 (3.37%) DevOps Engineer
9 17 (3.01%) Audit Manager
10 16 (2.84%) Full-Stack Engineer
10 16 (2.84%) Team Leader
11 15 (2.66%) Risk Manager
11 15 (2.66%) Senior Architect
11 15 (2.66%) Senior Solutions Architect
12 13 (2.30%) AWS DevOps
12 13 (2.30%) AWS DevOps Engineer
12 13 (2.30%) AWS Engineer
12 13 (2.30%) Lead Developer
12 13 (2.30%) Technology Risk Manager
Libraries, Frameworks & Software Standards
1 27 (4.79%) React
2 26 (4.61%) AngularJS
3 17 (3.01%) Bootstrap
4 13 (2.30%) React Native
5 11 (1.95%) Backbone.js
5 11 (1.95%) Ember.js
5 11 (1.95%) jQuery
6 9 (1.60%) .NET
6 9 (1.60%) Flutter
6 9 (1.60%) RESTful
7 8 (1.42%) Middleware
8 7 (1.24%) CSS
8 7 (1.24%) OAuth
8 7 (1.24%) Unity (Game Engine)
9 6 (1.06%) Chai
9 6 (1.06%) GraphQL
9 6 (1.06%) LESS
9 6 (1.06%) MobX
9 6 (1.06%) OAuth2
9 6 (1.06%) Sass
Miscellaneous
1 34 (6.03%) Hybrid Cloud
2 30 (5.32%) e-Learning
3 26 (4.61%) Cloud Native
4 25 (4.43%) Product Ownership
5 23 (4.08%) Blockchain
5 23 (4.08%) Robotics
6 16 (2.84%) Management Information System
7 14 (2.48%) Data Structures
7 14 (2.48%) Mobile App
8 13 (2.30%) Algorithms
9 12 (2.13%) Public Cloud
10 11 (1.95%) Cyberattack
11 8 (1.42%) Marketing Technology
12 7 (1.24%) Analytical Mindset
12 7 (1.24%) Cyber Defence
12 7 (1.24%) Data Centre
12 7 (1.24%) Digital Media
12 7 (1.24%) Legacy Systems
12 7 (1.24%) Mobile Games
12 7 (1.24%) PMI
Operating Systems
1 99 (17.55%) Windows
2 68 (12.06%) Windows Server 2012
3 26 (4.61%) Apple iOS
4 22 (3.90%) Android
5 16 (2.84%) Linux
6 9 (1.60%) Windows 10
7 5 (0.89%) Windows Server
8 1 (0.18%) Ubuntu
8 1 (0.18%) Windows Server 2016
8 1 (0.18%) Windows Server 2019
Processes & Methodologies
1 283 (50.18%) Mentoring
2 223 (39.54%) Agile
3 126 (22.34%) Problem-Solving
4 93 (16.49%) Risk Management
5 88 (15.60%) Analytics
6 83 (14.72%) Artificial Intelligence
7 78 (13.83%) Continuous Improvement
8 77 (13.65%) Stakeholder Management
9 74 (13.12%) Project Management
10 73 (12.94%) DevOps
11 67 (11.88%) Broadcast Engineering
11 67 (11.88%) Post-Production
11 67 (11.88%) Proactive Maintenance
11 67 (11.88%) Proactive Monitoring
11 67 (11.88%) Procure-to-Pay
12 64 (11.35%) Data Analytics
13 60 (10.64%) Roadmaps
14 57 (10.11%) Creative Thinking
15 50 (8.87%) Thought Leadership
16 49 (8.69%) Strategic Thinking
Programming Languages
1 56 (9.93%) Python
2 49 (8.69%) SQL
3 30 (5.32%) Java
4 18 (3.19%) JavaScript
5 15 (2.66%) C#
6 14 (2.48%) TypeScript
7 11 (1.95%) Kotlin
8 9 (1.60%) Swift
9 8 (1.42%) Objective-C
9 8 (1.42%) PowerShell
10 6 (1.06%) Go
11 5 (0.89%) R
11 5 (0.89%) Ruby
12 4 (0.71%) Rust
13 3 (0.53%) Bash
13 3 (0.53%) C
13 3 (0.53%) C++
13 3 (0.53%) T-SQL
14 2 (0.35%) Data Analysis Expressions
15 1 (0.18%) Scala
Qualifications
1 141 (25.00%) Degree
2 36 (6.38%) Security Cleared
3 21 (3.72%) CISA
4 18 (3.19%) SC Cleared
5 17 (3.01%) DBS Check
6 14 (2.48%) DV Cleared
7 13 (2.30%) ACCA
7 13 (2.30%) CCAB
7 13 (2.30%) CIMA
7 13 (2.30%) CIPFA
7 13 (2.30%) ICAEW
8 12 (2.13%) ISACA
9 11 (1.95%) Master's Degree
9 11 (1.95%) PMI Certification
10 9 (1.60%) Computer Science Degree
11 8 (1.42%) NVQ Level 4
12 7 (1.24%) CRISC
13 4 (0.71%) Azure Certification
13 4 (0.71%) HND
13 4 (0.71%) MBA
Quality Assurance & Compliance
1 38 (6.74%) QA
2 27 (4.79%) ITGC
3 13 (2.30%) Data Quality
4 11 (1.95%) Accessibility
4 11 (1.95%) PMBOK
5 9 (1.60%) PMO
5 9 (1.60%) Sarbanes-Oxley
6 8 (1.42%) GDPR
7 7 (1.24%) COBIT
8 6 (1.06%) P3O
9 4 (0.71%) NIST
10 3 (0.53%) GRC
10 3 (0.53%) ISO 20022
10 3 (0.53%) SLA
11 2 (0.35%) ISO/IEC 17025
11 2 (0.35%) NCSC
12 1 (0.18%) ISO 9001
12 1 (0.18%) ISO/IEC 27001
12 1 (0.18%) NEBOSH
System Software
1 80 (14.18%) Active Directory
2 14 (2.48%) Docker
3 4 (0.71%) Virtual Servers
4 1 (0.18%) Virtual Desktop
4 1 (0.18%) VMware ESXi
4 1 (0.18%) VMware Infrastructure
4 1 (0.18%) vSphere
Systems Management
1 25 (4.43%) Kubernetes
2 21 (3.72%) Terraform
3 3 (0.53%) Ansible
3 3 (0.53%) Microsoft Intune
3 3 (0.53%) SCCM
4 2 (0.35%) Progress Chef
4 2 (0.35%) Single Sign-On
5 1 (0.18%) Active Directory Federation Services
5 1 (0.18%) Argo
5 1 (0.18%) Consul
5 1 (0.18%) Control-M
5 1 (0.18%) DatAdvantage
5 1 (0.18%) Grafana
5 1 (0.18%) Kibana
5 1 (0.18%) logstash
5 1 (0.18%) Packer
5 1 (0.18%) Puppet
5 1 (0.18%) RSA Archer
5 1 (0.18%) Salt
5 1 (0.18%) vCenter Server
Vendors
1 128 (22.70%) Microsoft
2 67 (11.88%) Sun
3 34 (6.03%) Adobe
4 30 (5.32%) IBM
5 25 (4.43%) TikTok
6 22 (3.90%) Red Hat
7 21 (3.72%) Google
8 17 (3.01%) SAP
9 13 (2.30%) Oracle
10 8 (1.42%) Facebook
10 8 (1.42%) ServiceNow
11 7 (1.24%) Apple
11 7 (1.24%) Databricks
11 7 (1.24%) New Relic
11 7 (1.24%) YouTube
12 6 (1.06%) Foundry
13 4 (0.71%) Nuix
13 4 (0.71%) Planview
13 4 (0.71%) Recommind
13 4 (0.71%) Salesforce