Organisational Skills Jobs in London

Organisational Skills
England > London

The table below looks at the prevalence of the term Organisational Skills in permanent job vacancies in London. Included is a benchmarking guide to the salaries offered in vacancies that cited Organisational Skills over the 6 months leading up to 1 May 2025, comparing them to the same period in the previous two years.

6 months to
1 May 2025
Same period 2024 Same period 2023
Rank 139 177 229
Rank change year-on-year +38 +52 +18
Permanent jobs citing Organisational Skills 324 414 580
As % of all permanent jobs advertised in London 2.54% 1.75% 1.63%
As % of the General category 3.34% 2.60% 2.37%
Number of salaries quoted 171 298 375
10th Percentile £28,000 £26,786 £27,200
25th Percentile £37,750 £32,500 £40,825
Median annual salary (50th Percentile) £57,500 £42,500 £55,414
Median % change year-on-year +35.29% -23.30% -7.64%
75th Percentile £70,000 £66,250 £72,500
90th Percentile £95,000 £78,750 £92,500
England median annual salary £42,500 £35,000 £45,000
% change year-on-year +21.43% -22.22% -6.08%

All General Skills
London

Organisational Skills falls under the General Skills category. For comparison with the information above, the following table provides summary statistics for all permanent job vacancies requiring common skills in London.

Permanent vacancies with a requirement for common skills 9,710 15,940 24,479
As % of all permanent jobs advertised in London 76.23% 67.49% 68.93%
Number of salaries quoted 5,592 11,379 16,847
10th Percentile £41,288 £36,250 £42,500
25th Percentile £56,250 £51,000 £55,000
Median annual salary (50th Percentile) £75,000 £70,000 £74,000
Median % change year-on-year +7.14% -5.41% +5.71%
75th Percentile £102,500 £95,000 £95,000
90th Percentile £125,000 £117,500 £120,000
England median annual salary £57,500 £52,500 £60,249
% change year-on-year +9.52% -12.86% +0.42%

Organisational Skills
Job Vacancy Trend in London

Job postings citing Organisational Skills as a proportion of all IT jobs advertised in London.
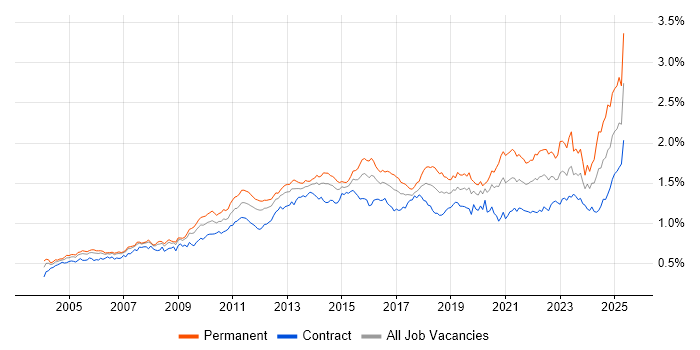
Job vacancy trend for Organisational Skills in London

Organisational Skills
Salary Trend in London

3-month moving average salary quoted in jobs citing Organisational Skills in London.

Salary trend for Organisational Skills in London

Organisational Skills
Salary Histogram in London

Salary distribution for jobs citing Organisational Skills in London over the 6 months to 1 May 2025.

Salary histogram for Organisational Skills in London

Organisational Skills
Job Locations in London

The table below looks at the demand and provides a guide to the median salaries quoted in IT jobs citing Organisational Skills within the London region over the 6 months to 1 May 2025. The 'Rank Change' column provides an indication of the change in demand within each location based on the same 6 month period last year.

Location Rank Change
on Same Period
Last Year
Matching
Permanent
IT Job Ads
Median Salary
Past 6 Months
Median Salary
% Change
on Same Period
Last Year
Live
Jobs
Central London +17 60 £52,725 -12.13% 32
South London -11 14 £33,000 -4.56% 9
East London +1 8 £52,500 +16.67% 8
North London +5 1 £60,000 +84.62% 4
Organisational Skills
England

Organisational Skills
Co-occurring Skills and Capabilities in London by Category

The follow tables expand on the table above by listing co-occurrences grouped by category. The same employment type, locality and period is covered with up to 20 co-occurrences shown in each of the following categories:

Application Platforms
1 10 (3.09%) WordPress
2 9 (2.78%) SharePoint
3 6 (1.85%) Microsoft Exchange
4 3 (0.93%) CMS
4 3 (0.93%) OpenStack
5 1 (0.31%) Apache
Applications
1 49 (15.12%) Microsoft Office
2 38 (11.73%) Microsoft Excel
3 8 (2.47%) Microsoft PowerPoint
4 6 (1.85%) MS Visio
5 5 (1.54%) Microsoft Project
6 4 (1.23%) Photoshop
7 2 (0.62%) Adobe Creative Suite
7 2 (0.62%) Adobe Illustrator
7 2 (0.62%) InDesign
7 2 (0.62%) Simulink
7 2 (0.62%) Trello
Business Applications
1 24 (7.41%) NetSuite
2 7 (2.16%) Dynamics NAV
3 3 (0.93%) Dynamics CRM
4 2 (0.62%) Fidessa
4 2 (0.62%) Raiser’s Edge
5 1 (0.31%) Adobe Campaign
5 1 (0.31%) Eikon
5 1 (0.31%) SAP S/4HANA
5 1 (0.31%) Shopify
Cloud Services
1 23 (7.10%) Microsoft 365
2 20 (6.17%) Azure
3 18 (5.56%) AWS
4 16 (4.94%) Power Platform
5 12 (3.70%) Amazon S3
5 12 (3.70%) Amazon SQS
5 12 (3.70%) Serverless
6 9 (2.78%) AWS Lambda
7 8 (2.47%) Dropbox
7 8 (2.47%) Google Docs
7 8 (2.47%) Google Drive
7 8 (2.47%) Google Sheets
8 6 (1.85%) Canva
8 6 (1.85%) Google Analytics
8 6 (1.85%) SaaS
9 5 (1.54%) Dynamics 365
9 5 (1.54%) OneDrive
9 5 (1.54%) PaaS
10 4 (1.23%) Entra ID
11 3 (0.93%) Azure Data Factory
Communications & Networking
1 11 (3.40%) Internet
2 10 (3.09%) Firewall
3 7 (2.16%) Network Security
3 7 (2.16%) TCP/IP
4 6 (1.85%) Wireless
5 5 (1.54%) Intrusion Detection
5 5 (1.54%) IPsec
5 5 (1.54%) SSL
6 4 (1.23%) LAN
6 4 (1.23%) VPN
6 4 (1.23%) WAN
7 2 (0.62%) Ethernet
7 2 (0.62%) Modbus
7 2 (0.62%) NetScaler
7 2 (0.62%) Profibus
7 2 (0.62%) VoIP
8 1 (0.31%) DHCP
8 1 (0.31%) DKIM
8 1 (0.31%) DMARC
8 1 (0.31%) Wi-Fi
Database & Business Intelligence
1 16 (4.94%) Power BI
2 8 (2.47%) Looker
3 6 (1.85%) Data Lake
4 5 (1.54%) Relational Database
5 4 (1.23%) Big Data
5 4 (1.23%) PostgreSQL
5 4 (1.23%) SQL Server
6 2 (0.62%) Data Warehouse
6 2 (0.62%) Tableau
7 1 (0.31%) Electronic Patient Records
7 1 (0.31%) Spatial Data
7 1 (0.31%) SQL Server Analysis Services
7 1 (0.31%) SQL Server Integration Services
7 1 (0.31%) SQL Server Reporting Services
Development Applications
1 4 (1.23%) JIRA
2 3 (0.93%) ERwin
2 3 (0.93%) Git
2 3 (0.93%) Jenkins
3 1 (0.31%) SQL Server Management Studio (SSMS)
General
1 198 (61.11%) Social Skills
2 101 (31.17%) Finance
3 91 (28.09%) Analytical Skills
4 56 (17.28%) Marketing
5 25 (7.72%) Legal
6 24 (7.41%) Inclusion and Diversity
7 22 (6.79%) Influencing Skills
8 20 (6.17%) Publishing
9 13 (4.01%) Banking
10 12 (3.70%) Presentation Skills
11 11 (3.40%) Multimedia
12 10 (3.09%) Law
12 10 (3.09%) Retail
13 9 (2.78%) Health Technology
13 9 (2.78%) Tech for Good
14 7 (2.16%) Local Government
14 7 (2.16%) Public Sector
15 5 (1.54%) German Language
16 4 (1.23%) Public Speaking
17 3 (0.93%) French Language
Job Titles
1 64 (19.75%) Analyst
2 36 (11.11%) Consultant
3 31 (9.57%) Senior
4 28 (8.64%) Functional Consultant
5 24 (7.41%) NetSuite Consultant
6 22 (6.79%) Project Manager
7 20 (6.17%) Coordinator
8 15 (4.63%) Lead
9 13 (4.01%) IT Analyst
9 13 (4.01%) Support Analyst
10 12 (3.70%) Developer
10 12 (3.70%) Head of Design
10 12 (3.70%) Security Analyst
11 10 (3.09%) Administrator
12 9 (2.78%) Service Analyst
13 8 (2.47%) Business Analyst
13 8 (2.47%) IT Support
13 8 (2.47%) Senior Analyst
13 8 (2.47%) Software Engineer
14 7 (2.16%) Information Security Analyst
Libraries, Frameworks & Software Standards
1 10 (3.09%) RESTful
2 7 (2.16%) EDI
3 4 (1.23%) Kafka
3 4 (1.23%) REST
3 4 (1.23%) Spring
3 4 (1.23%) Spring Boot
4 3 (0.93%) Elastic Stack
4 3 (0.93%) Mustache
4 3 (0.93%) Node.js
4 3 (0.93%) React
4 3 (0.93%) Web Services
5 2 (0.62%) Django
6 1 (0.31%) .NET
6 1 (0.31%) .NET Core
6 1 (0.31%) Akka
6 1 (0.31%) AngularJS
6 1 (0.31%) Apache Beam
6 1 (0.31%) HTML5 Canvas
6 1 (0.31%) SOAP
Miscellaneous
1 29 (8.95%) Social Media
2 22 (6.79%) Management Information System
3 18 (5.56%) Self-Motivation
4 14 (4.32%) Animation
5 12 (3.70%) Onboarding
6 10 (3.09%) Analytical Mindset
7 8 (2.47%) Security Posture
7 8 (2.47%) Video on Demand
8 5 (1.54%) Distributed Systems
9 4 (1.23%) CMDB
9 4 (1.23%) Virtual Team
10 3 (0.93%) CCTV
10 3 (0.93%) Data Centre
10 3 (0.93%) Data Protection Act
10 3 (0.93%) e-Learning
10 3 (0.93%) Low-Code
10 3 (0.93%) Video Conferencing
11 2 (0.62%) Derivative
11 2 (0.62%) Graphic Design
11 2 (0.62%) Reference Data
Operating Systems
1 28 (8.64%) Windows
2 7 (2.16%) Linux
3 5 (1.54%) Windows 10
3 5 (1.54%) Windows Server
4 3 (0.93%) Apple iOS
5 2 (0.62%) AIX
5 2 (0.62%) Android
5 2 (0.62%) Windows Server 2016
Processes & Methodologies
1 96 (29.63%) Problem-Solving
2 69 (21.30%) Project Management
3 54 (16.67%) Time Management
4 46 (14.20%) Analytics
5 45 (13.89%) CRM
6 43 (13.27%) Mentoring
7 42 (12.96%) Collaborative Working
8 40 (12.35%) Agile
9 36 (11.11%) Decision-Making
10 32 (9.88%) Customer Service
11 31 (9.57%) Continuous Improvement
11 31 (9.57%) Migration
12 29 (8.95%) ERP
13 28 (8.64%) ITIL
13 28 (8.64%) Risk Management
14 27 (8.33%) Data Migration
15 24 (7.41%) Requirements Gathering
16 23 (7.10%) Cybersecurity
16 23 (7.10%) Roadmaps
16 23 (7.10%) Stakeholder Management
Programming Languages
1 22 (6.79%) Python
2 16 (4.94%) SQL
3 7 (2.16%) R
4 5 (1.54%) Delphi
4 5 (1.54%) JavaScript
5 4 (1.23%) Java
5 4 (1.23%) PowerShell
6 3 (0.93%) Data Analysis Expressions
7 2 (0.62%) MATLAB
8 1 (0.31%) C#
8 1 (0.31%) C++
8 1 (0.31%) Clipper
8 1 (0.31%) PHP
8 1 (0.31%) Scala
8 1 (0.31%) T-SQL
8 1 (0.31%) TypeScript
8 1 (0.31%) VBA
Qualifications
1 55 (16.98%) Degree
2 6 (1.85%) DBS Check
2 6 (1.85%) Microsoft Certification
3 5 (1.54%) CompTIA CySA+
3 5 (1.54%) CompTIA Security+
3 5 (1.54%) GIAC
3 5 (1.54%) MCSA
4 4 (1.23%) PMP
4 4 (1.23%) Postgraduate
5 3 (0.93%) ACCA
5 3 (0.93%) CCIE
5 3 (0.93%) CCNP
5 3 (0.93%) CCSE
5 3 (0.93%) CIMA
5 3 (0.93%) Cisco Certification
5 3 (0.93%) CISM
5 3 (0.93%) CISSP
5 3 (0.93%) ITIL Certification
5 3 (0.93%) PhD
5 3 (0.93%) PMI Certification
Quality Assurance & Compliance
1 29 (8.95%) QA
2 17 (5.25%) ISO/IEC 27001
3 11 (3.40%) SLA
4 9 (2.78%) NIST
5 8 (2.47%) Data Quality
5 8 (2.47%) GDPR
6 5 (1.54%) Accessibility
6 5 (1.54%) NCSC
7 3 (0.93%) COBIT
7 3 (0.93%) GAAP
7 3 (0.93%) PMO
8 2 (0.62%) IEC 61131
8 2 (0.62%) ISO 9001
8 2 (0.62%) Sarbanes-Oxley
9 1 (0.31%) Cyber Essentials
9 1 (0.31%) Cyber Essentials PLUS
9 1 (0.31%) DICOM
9 1 (0.31%) HL7
9 1 (0.31%) ISO 20022
9 1 (0.31%) SEPA
System Software
1 16 (4.94%) Active Directory
2 6 (1.85%) Firmware
3 5 (1.54%) Docker
4 4 (1.23%) VMware Infrastructure
5 3 (0.93%) Hyper-V
6 2 (0.62%) VMware ESXi
7 1 (0.31%) Virtual Machines
Systems Management
1 10 (3.09%) SCCM
2 8 (2.47%) Microsoft Intune
3 6 (1.85%) Kubernetes
3 6 (1.85%) WSUS
4 3 (0.93%) Single Sign-On
5 2 (0.62%) vCenter Server
6 1 (0.31%) Avamar
6 1 (0.31%) Backup Exec
6 1 (0.31%) EMC NetWorker
Vendors
1 89 (27.47%) Microsoft
2 28 (8.64%) Google
3 12 (3.70%) Cisco
4 11 (3.40%) Citrix
5 10 (3.09%) Apple
6 9 (2.78%) Salesforce
6 9 (2.78%) SAP
7 7 (2.16%) Screaming Frog
7 7 (2.16%) ServiceNow
8 5 (1.54%) Fortinet
8 5 (1.54%) VMware
9 4 (1.23%) Duck Creek
9 4 (1.23%) Facebook
9 4 (1.23%) Instagram
9 4 (1.23%) Pardot
10 3 (0.93%) Arista
10 3 (0.93%) Databricks
10 3 (0.93%) DocuSign
10 3 (0.93%) FactSet
10 3 (0.93%) Palo Alto