Microsoft Office Jobs in London

Microsoft Office
England > London

The table below provides summary statistics for permanent job vacancies advertised in London requiring Microsoft Office skills. It includes a benchmarking guide to the annual salaries offered in vacancies that cited Microsoft Office over the 6 months leading up to 26 July 2024, comparing them to the same period in the previous two years.

6 months to
26 Jul 2024
Same period 2023 Same period 2022
Rank 78 82 173
Rank change year-on-year +4 +91 +3
Permanent jobs citing Microsoft Office 783 1,001 1,944
As % of all permanent jobs advertised in London 3.78% 3.69% 2.59%
As % of the Applications category 40.30% 45.46% 29.95%
Number of salaries quoted 501 723 1,118
10th Percentile £28,500 £28,250 £26,250
25th Percentile £35,000 £35,000 £31,569
Median annual salary (50th Percentile) £47,500 £50,000 £47,500
Median % change year-on-year -5.00% +5.26% -
75th Percentile £68,750 £67,500 £60,000
90th Percentile £85,000 £89,970 £76,475
England median annual salary £35,000 £40,000 £37,500
% change year-on-year -12.50% +6.67% -6.25%

All Software Application Skills
London

Microsoft Office falls under the Software Applications category. For comparison with the information above, the following table provides summary statistics for all permanent job vacancies requiring software application skills in London.

Permanent vacancies with a requirement for software application skills 1,943 2,202 6,491
As % of all permanent jobs advertised in London 9.37% 8.12% 8.65%
Number of salaries quoted 1,020 1,535 2,839
10th Percentile £30,000 £31,250 £30,000
25th Percentile £36,750 £38,000 £37,505
Median annual salary (50th Percentile) £52,500 £55,000 £55,000
Median % change year-on-year -4.55% - +1.85%
75th Percentile £70,000 £72,000 £70,000
90th Percentile £85,000 £87,500 £86,250
England median annual salary £40,450 £45,000 £45,000
% change year-on-year -10.11% - -

Microsoft Office
Job Vacancy Trend in London

Job postings citing Microsoft Office as a proportion of all IT jobs advertised in London.
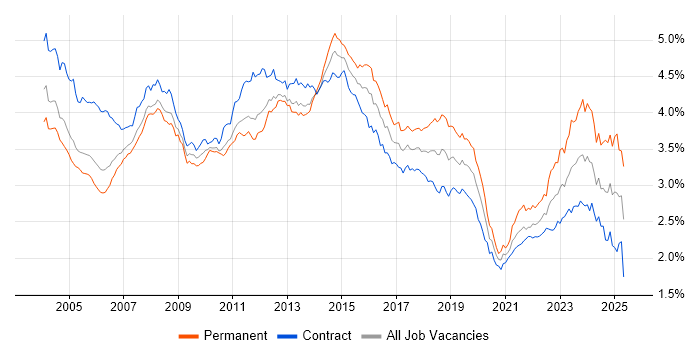
Job vacancy trend for Microsoft Office in London

Microsoft Office
Salary Trend in London

3-month moving average salary quoted in jobs citing Microsoft Office in London.

Salary trend for Microsoft Office in London

Microsoft Office
Salary Histogram in London

Salary distribution for jobs citing Microsoft Office in London over the 6 months to 26 July 2024.

Salary histogram for Microsoft Office in London

Microsoft Office
Job Locations in London

The table below looks at the demand and provides a guide to the median salaries quoted in IT jobs citing Microsoft Office within the London region over the 6 months to 26 July 2024. The 'Rank Change' column provides an indication of the change in demand within each location based on the same 6 month period last year.

Location Rank Change
on Same Period
Last Year
Matching
Permanent
IT Job Ads
Median Salary
Past 6 Months
Median Salary
% Change
on Same Period
Last Year
Live
Jobs
Central London +2 135 £54,000 +35.00% 40
South London +22 112 £41,750 +9.87% 10
West London -23 26 £32,500 -4.06% 35
East London +15 17 £110,000 +201.37% 26
North London +4 5 £32,060 +16.58% 3
Microsoft Office
England

Microsoft Office
Co-occurring Skills and Capabilities in London by Category

The follow tables expand on the table above by listing co-occurrences grouped by category. The same employment type, locality and period is covered with up to 20 co-occurrences shown in each of the following categories:

Application Platforms
1 85 (10.86%) SharePoint
2 66 (8.43%) Microsoft Exchange
3 15 (1.92%) Confluence
4 10 (1.28%) CMS
4 10 (1.28%) Skype for Business
5 8 (1.02%) IIS
6 5 (0.64%) IBM Domino
6 5 (0.64%) SAS
7 4 (0.51%) Office Communications Server
8 3 (0.38%) IBM Notes
9 2 (0.26%) Apache
9 2 (0.26%) Apache Airflow
9 2 (0.26%) Apache Spark
10 1 (0.13%) Exchange Server 2007
10 1 (0.13%) Exchange Server 2010
10 1 (0.13%) Exchange Server 2013
10 1 (0.13%) WordPress
Applications
1 271 (34.61%) Microsoft Excel
2 94 (12.01%) Microsoft PowerPoint
3 34 (4.34%) MS Visio
4 19 (2.43%) Microsoft Project
5 11 (1.40%) Adobe Creative Suite
6 6 (0.77%) InDesign
7 5 (0.64%) Photoshop
8 4 (0.51%) AutoCAD
8 4 (0.51%) Spreadsheet
8 4 (0.51%) SPSS
9 3 (0.38%) Adobe Premiere
10 2 (0.26%) Adobe Captivate
11 1 (0.13%) Acrobat
11 1 (0.13%) Camtasia
11 1 (0.13%) Trello
Business Applications
1 10 (1.28%) Elite 3E
2 8 (1.02%) Relativity
3 6 (0.77%) Dynamics CRM
4 3 (0.38%) Carpe Diem
4 3 (0.38%) FastStats
4 3 (0.38%) FastStats PeopleStage
4 3 (0.38%) Salesforce CRM
5 2 (0.26%) Dynamics NAV
5 2 (0.26%) Endur
5 2 (0.26%) Farmplan
5 2 (0.26%) KEYPrime
5 2 (0.26%) NetSuite
5 2 (0.26%) Primavera
5 2 (0.26%) SAP GRC
5 2 (0.26%) SAP SD
5 2 (0.26%) Veritas eDiscovery
6 1 (0.13%) Eikon
6 1 (0.13%) SAP MM
6 1 (0.13%) SAP WM
6 1 (0.13%) Shopify
Cloud Services
1 179 (22.86%) Microsoft 365
2 97 (12.39%) Azure
3 66 (8.43%) Power Platform
4 29 (3.70%) Entra ID
5 23 (2.94%) SaaS
6 22 (2.81%) AWS
7 19 (2.43%) Azure DevOps
8 15 (1.92%) Google Workspace
9 12 (1.53%) PaaS
10 11 (1.40%) Power Automate
11 10 (1.28%) GCP
12 9 (1.15%) IaaS
13 8 (1.02%) Mimecast
13 8 (1.02%) Snowflake
13 8 (1.02%) WhatsApp
14 7 (0.89%) Figma
14 7 (0.89%) Google Drive
15 6 (0.77%) Dynamics 365
15 6 (0.77%) PowerApps
16 5 (0.64%) BrowserStack
Communications & Networking
1 41 (5.24%) Firewall
2 37 (4.73%) DNS
3 24 (3.07%) DHCP
4 22 (2.81%) TCP/IP
5 19 (2.43%) LAN
6 18 (2.30%) VPN
6 18 (2.30%) WAN
6 18 (2.30%) Wireless
7 16 (2.04%) WebEx
8 13 (1.66%) Skype
9 11 (1.40%) Broadband
9 11 (1.40%) Telepresence
9 11 (1.40%) VoIP
10 10 (1.28%) Internet
10 10 (1.28%) Remote Desktop
11 8 (1.02%) Structured Cabling
12 7 (0.89%) Cisco IOS
13 6 (0.77%) Intranet
13 6 (0.77%) Wi-Fi
14 4 (0.51%) Network Security
Database & Business Intelligence
1 56 (7.15%) Power BI
2 31 (3.96%) SQL Server
3 23 (2.94%) Tableau
4 12 (1.53%) Big Data
5 11 (1.40%) Relational Database
6 10 (1.28%) SQL Server Reporting Services
7 8 (1.02%) Data Warehouse
7 8 (1.02%) Metadata
8 7 (0.89%) EDRMS
8 7 (0.89%) PostgreSQL
9 6 (0.77%) Amazon QuickSight
9 6 (0.77%) SQL Server Integration Services
10 5 (0.64%) Azure SQL Database
10 5 (0.64%) MySQL
11 4 (0.51%) Data Lake
11 4 (0.51%) Essbase
11 4 (0.51%) Oracle Database
12 3 (0.38%) RDBMS
12 3 (0.38%) SQLite
13 2 (0.26%) SAP BW
Development Applications
1 38 (4.85%) JIRA
2 8 (1.02%) Git
2 8 (1.02%) Jenkins
3 6 (0.77%) Selenium
4 5 (0.64%) NUnit
4 5 (0.64%) SpecFlow
4 5 (0.64%) Visual Studio
5 4 (0.51%) Mercurial
6 2 (0.26%) MLflow
7 1 (0.13%) Bitbucket
7 1 (0.13%) Hudson
7 1 (0.13%) Subversion
7 1 (0.13%) Team Foundation Server
7 1 (0.13%) Visual Studio Team System
General
1 415 (53.00%) Social Skills
2 184 (23.50%) Finance
3 164 (20.95%) Organisational Skills
4 131 (16.73%) Analytical Skills
5 128 (16.35%) Legal
6 69 (8.81%) Inclusion and Diversity
7 57 (7.28%) Law
8 56 (7.15%) Marketing
9 50 (6.39%) Presentation Skills
10 37 (4.73%) Retail
11 32 (4.09%) German Language
12 29 (3.70%) Banking
13 27 (3.45%) Multimedia
14 25 (3.19%) French Language
15 24 (3.07%) Telecoms
16 19 (2.43%) Dutch Language
16 19 (2.43%) Public Speaking
17 17 (2.17%) Documentation Skills
18 16 (2.04%) Advertising
19 13 (1.66%) Pharmaceutical
Job Titles
1 151 (19.28%) Analyst
2 104 (13.28%) Senior
3 65 (8.30%) Coordinator
4 58 (7.41%) IT Support
5 57 (7.28%) Administrator
6 51 (6.51%) Support Engineer
7 41 (5.24%) Support Analyst
8 38 (4.85%) Desktop Support
9 37 (4.73%) Lead
9 37 (4.73%) Project Manager
10 36 (4.60%) IT Analyst
11 30 (3.83%) Senior Analyst
12 27 (3.45%) Trainer
13 25 (3.19%) Consultant
13 25 (3.19%) IT Support Analyst
14 24 (3.07%) Desktop Engineer
15 23 (2.94%) Business Analyst
16 22 (2.81%) Desktop Support Engineer
17 21 (2.68%) IT Engineer
18 20 (2.55%) 1st Line Support
Libraries, Frameworks & Software Standards
1 11 (1.40%) CSS
2 10 (1.28%) HTML
2 10 (1.28%) XML
3 8 (1.02%) .NET
4 7 (0.89%) Web Services
5 6 (0.77%) Middleware
6 5 (0.64%) JSON
6 5 (0.64%) XMPP
6 5 (0.64%) YAML
7 4 (0.51%) EDI
8 3 (0.38%) .NET Framework
8 3 (0.38%) AngularJS
8 3 (0.38%) HTML5 Canvas
8 3 (0.38%) jQuery
8 3 (0.38%) Oracle Fusion
8 3 (0.38%) Spring
9 2 (0.26%) PyTorch
9 2 (0.26%) React
9 2 (0.26%) scikit-learn
9 2 (0.26%) TensorFlow
Miscellaneous
1 101 (12.90%) Self-Motivation
2 62 (7.92%) Management Information System
3 35 (4.47%) Onboarding
3 35 (4.47%) Social Media
4 28 (3.58%) Learning Management System
5 27 (3.45%) e-Learning
6 25 (3.19%) Video Conferencing
7 21 (2.68%) Driving Licence
8 19 (2.43%) Data Centre
9 18 (2.30%) Enterprise Software
10 17 (2.17%) Smartphone
11 15 (1.92%) Product Ownership
12 14 (1.79%) iPhone
13 13 (1.66%) Blog
13 13 (1.66%) Data Structures
13 13 (1.66%) iPad
14 10 (1.28%) Reinsurance
15 9 (1.15%) Replication
15 9 (1.15%) Virtual Team
16 8 (1.02%) Blackberry
Operating Systems
1 226 (28.86%) Windows
2 107 (13.67%) Windows 10
3 48 (6.13%) Windows Server
4 19 (2.43%) Apple iOS
5 18 (2.30%) Android
6 12 (1.53%) Windows 7
7 11 (1.40%) Mac OS
7 11 (1.40%) Windows Server 2019
8 10 (1.28%) Windows Server 2008
8 10 (1.28%) Windows Server 2016
9 9 (1.15%) Windows Server 2012
10 7 (0.89%) Linux
11 6 (0.77%) Mac OS X
12 4 (0.51%) Unix
13 1 (0.13%) Solaris
13 1 (0.13%) Windows 8
13 1 (0.13%) Windows Server 2003
Processes & Methodologies
1 202 (25.80%) Problem-Solving
2 120 (15.33%) ITIL
3 117 (14.94%) Project Management
4 113 (14.43%) Customer Service
5 74 (9.45%) Time Management
6 70 (8.94%) Agile
7 60 (7.66%) Mentoring
8 53 (6.77%) Business Intelligence
8 53 (6.77%) Decision-Making
8 53 (6.77%) ITSM
9 52 (6.64%) CRM
10 48 (6.13%) Analytics
11 45 (5.75%) Stakeholder Management
12 42 (5.36%) Change Management
13 40 (5.11%) Continuous Improvement
14 37 (4.73%) Collaborative Working
14 37 (4.73%) Cybersecurity
15 36 (4.60%) Document Management
16 34 (4.34%) Project Delivery
17 29 (3.70%) Coaching
Programming Languages
1 94 (12.01%) SQL
2 43 (5.49%) PowerShell
3 29 (3.70%) Python
4 13 (1.66%) T-SQL
5 12 (1.53%) C#
5 12 (1.53%) VBA
6 11 (1.40%) R
7 10 (1.28%) JavaScript
8 8 (1.02%) Bash
9 5 (0.64%) VBScript
10 4 (0.51%) Perl
10 4 (0.51%) Ruby
11 3 (0.38%) PL/SQL
12 2 (0.26%) Google Apps Script
12 2 (0.26%) Java
12 2 (0.26%) MATLAB
12 2 (0.26%) Scala
12 2 (0.26%) Shell Script
12 2 (0.26%) VB.NET
13 1 (0.13%) VB
Qualifications
1 273 (34.87%) Degree
2 40 (5.11%) DBS Check
3 30 (3.83%) Master's Degree
4 25 (3.19%) Microsoft Certification
5 17 (2.17%) Security Cleared
6 15 (1.92%) A+ Certification
6 15 (1.92%) ITIL Foundation Certificate
7 14 (1.79%) PMI Certification
8 13 (1.66%) Computer Science Degree
8 13 (1.66%) MCP
9 10 (1.28%) ITIL Certification
9 10 (1.28%) MCSA
9 10 (1.28%) SC Cleared
10 9 (1.15%) CISSP
10 9 (1.15%) PMP
11 8 (1.02%) CREST Certified
11 8 (1.02%) HNC
11 8 (1.02%) MCSE
12 7 (0.89%) CISM
13 6 (0.77%) MBA
Quality Assurance & Compliance
1 41 (5.24%) QA
2 27 (3.45%) Data Quality
3 19 (2.43%) SLA
4 16 (2.04%) GDPR
5 12 (1.53%) Accessibility
6 6 (0.77%) COBIT
6 6 (0.77%) ISO/IEC 27001
6 6 (0.77%) PMO
7 4 (0.51%) Cyber Essentials
8 3 (0.38%) ISO/IEC 27002 (supersedes ISO/IEC 17799)
8 3 (0.38%) NIST
8 3 (0.38%) Sarbanes-Oxley
9 2 (0.26%) GRC
9 2 (0.26%) ISO 9001
10 1 (0.13%) GMP
10 1 (0.13%) HIPAA
10 1 (0.13%) ISO 20022
10 1 (0.13%) ITGC
10 1 (0.13%) NEBOSH
10 1 (0.13%) PCI DSS
System Software
1 157 (20.05%) Active Directory
2 29 (3.70%) VMware Infrastructure
3 7 (0.89%) Hyper-V
4 3 (0.38%) Docker
4 3 (0.38%) Forefront TMG
4 3 (0.38%) VMware ESXi
4 3 (0.38%) VMware Workstation
4 3 (0.38%) vSphere
5 2 (0.26%) Firmware
6 1 (0.13%) NFS
6 1 (0.13%) Terminal Services
6 1 (0.13%) Virtual Servers
Systems Management
1 49 (6.26%) SCCM
2 38 (4.85%) Microsoft Intune
3 13 (1.66%) Terraform
4 8 (1.02%) Ansible
4 8 (1.02%) WSUS
5 7 (0.89%) Jamf Pro
6 6 (0.77%) Single Sign-On
7 5 (0.64%) HP ALM
7 5 (0.64%) Systems Management Server (SMS)
8 4 (0.51%) McAfee ePO
8 4 (0.51%) SCOM
8 4 (0.51%) vCenter Server
9 3 (0.38%) AirWatch
10 2 (0.26%) RSA Archer
11 1 (0.13%) Cisco CUCM
11 1 (0.13%) FortiGate
11 1 (0.13%) NetBackup
11 1 (0.13%) Norton AntiVirus
11 1 (0.13%) SCOrch
11 1 (0.13%) Symantec Enterprise Vault
Vendors
1 573 (73.18%) Microsoft
2 43 (5.49%) Cisco
2 43 (5.49%) Google
3 38 (4.85%) Citrix
3 38 (4.85%) VMware
4 37 (4.73%) iManage
5 28 (3.58%) Adobe
6 23 (2.94%) Bloomberg
6 23 (2.94%) ServiceNow
7 22 (2.81%) Oracle
8 20 (2.55%) Apple
9 18 (2.30%) Intapp
9 18 (2.30%) Salesforce
10 13 (1.66%) Alteryx
11 11 (1.40%) HP
11 11 (1.40%) MobileIron
12 9 (1.15%) Palo Alto
13 8 (1.02%) Nuix
13 8 (1.02%) Refinitiv
13 8 (1.02%) Samsung