Accessibility Jobs in London

Accessibility (a11y)
England > London

The following table provides summary statistics for permanent job vacancies advertised in London with a requirement for Accessibility skills. Included is a benchmarking guide to the salaries offered in vacancies that have cited Accessibility over the 6 months to 12 May 2024 with a comparison to the same period in the previous 2 years.

6 months to
12 May 2024
Same period 2023 Same period 2022
Rank 296 265 230
Rank change year-on-year -31 -35 +83
Permanent jobs citing Accessibility 226 467 1,275
As % of all permanent jobs advertised in London 0.96% 1.36% 1.89%
As % of the Quality Assurance & Compliance category 6.71% 8.23% 11.63%
Number of salaries quoted 165 207 286
10th Percentile £42,250 £41,972 £43,086
25th Percentile £47,500 £50,957 £52,500
Median annual salary (50th Percentile) £64,500 £65,000 £65,000
Median % change year-on-year -0.77% - -
75th Percentile £82,500 £80,000 £79,688
90th Percentile £101,900 £105,000 £85,000
England median annual salary £55,000 £57,500 £53,112
% change year-on-year -4.35% +8.26% -3.43%

All Quality Assurance and Compliance Skills
London

Accessibility is in the Quality Assurance and Compliance category. The following table is for comparison with the above and provides summary statistics for all permanent job vacancies advertised in London with a requirement for quality assurance or compliance skills.

Permanent vacancies with a requirement for quality assurance or compliance skills 3,369 5,674 10,965
As % of all permanent jobs advertised in London 14.24% 16.51% 16.22%
Number of salaries quoted 2,486 3,642 5,200
10th Percentile £35,000 £40,000 £40,000
25th Percentile £50,000 £51,250 £51,250
Median annual salary (50th Percentile) £67,500 £67,500 £65,000
Median % change year-on-year - +3.85% -
75th Percentile £90,000 £86,250 £85,000
90th Percentile £111,250 £102,500 £100,000
England median annual salary £52,500 £57,500 £55,000
% change year-on-year -8.70% +4.55% -

Accessibility
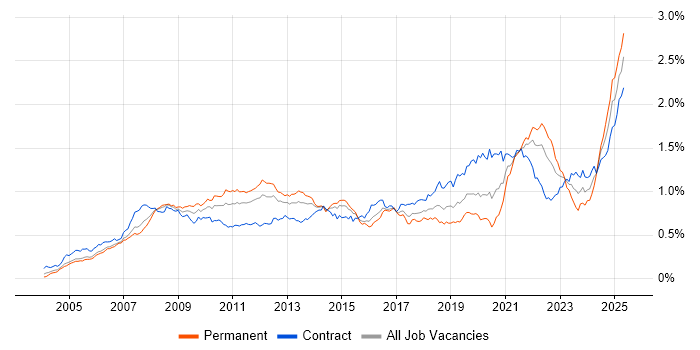
Job Vacancy Trend in London

Job postings citing Accessibility as a proportion of all IT jobs advertised in London.

Job vacancy trend for Accessibility in London

Accessibility
Salary Trend in London

3-month moving average salary quoted in jobs citing Accessibility in London.

Salary trend for Accessibility in London

Accessibility
Salary Histogram in London

Salary distribution for jobs citing Accessibility in London over the 6 months to 12 May 2024.

Salary histogram for Accessibility in London

Accessibility
Job Locations in London

The table below looks at the demand and provides a guide to the median salaries quoted in IT jobs citing Accessibility within the London region over the 6 months to 12 May 2024. The 'Rank Change' column provides an indication of the change in demand within each location based on the same 6 month period last year.

Location Rank Change
on Same Period
Last Year
Matching
Permanent
IT Job Ads
Median Salary
Past 6 Months
Median Salary
% Change
on Same Period
Last Year
Live
Jobs
Central London +51 39 £75,000 - 11
East London +18 1 £64,500 +20.00% 5
West London -3 1 - - 10
Accessibility
England

Accessibility
Co-occurring Skills and Capabilities in London by Category

The follow tables expand on the table above by listing co-occurrences grouped by category. The same employment type, locality and period is covered with up to 20 co-occurrences shown in each of the following categories:

Application Platforms
1 14 (6.19%) CMS
2 9 (3.98%) Umbraco
3 8 (3.54%) SharePoint
3 8 (3.54%) Sitecore CMS
4 7 (3.10%) Adobe Experience Manager
4 7 (3.10%) Apache
4 7 (3.10%) IIS
4 7 (3.10%) Tomcat
5 6 (2.65%) Apache Solr
5 6 (2.65%) WordPress
6 3 (1.33%) Confluence
7 2 (0.88%) Apache Spark
7 2 (0.88%) Microsoft Exchange
7 2 (0.88%) Moodle
8 1 (0.44%) OpenZeppelin
Applications
1 13 (5.75%) Adobe XD
2 11 (4.87%) Microsoft Office
3 9 (3.98%) Sketch
4 6 (2.65%) Adobe Creative Suite
5 2 (0.88%) Adobe After Effects
5 2 (0.88%) Final Cut Pro
5 2 (0.88%) InVision
6 1 (0.44%) AutoCAD
6 1 (0.44%) Microsoft Excel
6 1 (0.44%) Revit
Business Applications
1 13 (5.75%) NEC Housing
2 7 (3.10%) Dynamics CRM
Cloud Services
1 56 (24.78%) Azure
2 38 (16.81%) AWS
3 21 (9.29%) Azure DevOps
3 21 (9.29%) Power Platform
4 18 (7.96%) SaaS
5 14 (6.19%) IaaS
6 13 (5.75%) Figma
6 13 (5.75%) GCP
7 9 (3.98%) Dynamics 365
8 7 (3.10%) PaaS
9 6 (2.65%) Azure Cognitive Search
9 6 (2.65%) Serverless
10 5 (2.21%) Google Analytics
11 4 (1.77%) GitHub
11 4 (1.77%) Heroku
11 4 (1.77%) Microsoft 365
11 4 (1.77%) Miro
12 3 (1.33%) Amazon EC2
12 3 (1.33%) Amazon S3
12 3 (1.33%) Google Ads
Communications & Networking
1 9 (3.98%) TCP/IP
2 8 (3.54%) LAN
2 8 (3.54%) WAN
3 2 (0.88%) DNS
3 2 (0.88%) SNA
4 1 (0.44%) Firewall
4 1 (0.44%) FTP
4 1 (0.44%) HTTP
4 1 (0.44%) IPFS
Database & Business Intelligence
1 17 (7.52%) SQL Server
2 14 (6.19%) Power BI
3 13 (5.75%) Oracle Database
4 8 (3.54%) Data Warehouse
4 8 (3.54%) Tableau
5 7 (3.10%) Big Data
6 6 (2.65%) Oracle Database 12c
6 6 (2.65%) PostgreSQL
7 4 (1.77%) Data Lake
7 4 (1.77%) MongoDB
7 4 (1.77%) QlikView
8 3 (1.33%) Amazon RDS
8 3 (1.33%) NoSQL
9 2 (0.88%) Redis
10 1 (0.44%) Data Mining
10 1 (0.44%) EDMS
10 1 (0.44%) Hadoop
10 1 (0.44%) Metadata
10 1 (0.44%) Spark SQL
10 1 (0.44%) SQL Server Integration Services
Development Applications
1 22 (9.73%) Git
2 16 (7.08%) Jenkins
3 15 (6.64%) Cucumber
4 14 (6.19%) Axure RP
5 13 (5.75%) Balsamiq
5 13 (5.75%) Postman
6 12 (5.31%) JMeter
7 11 (4.87%) Selenium
7 11 (4.87%) SpecFlow
7 11 (4.87%) TeamCity
8 10 (4.42%) JIRA
9 9 (3.98%) Gatling
10 7 (3.10%) webpack
11 6 (2.65%) LoadRunner
12 5 (2.21%) Cypress.io
12 5 (2.21%) Team Foundation Server
12 5 (2.21%) Visual Studio
13 4 (1.77%) GitLab
14 3 (1.33%) Appium
14 3 (1.33%) WebDriver
General
1 67 (29.65%) Social Skills
2 46 (20.35%) Finance
3 42 (18.58%) Inclusion and Diversity
4 39 (17.26%) Public Sector
5 36 (15.93%) Marketing
6 32 (14.16%) Analytical Skills
7 20 (8.85%) Presentation Skills
8 16 (7.08%) Local Government
8 16 (7.08%) Retail
9 14 (6.19%) Legal
9 14 (6.19%) Police
10 8 (3.54%) Back Office
10 8 (3.54%) Telecoms
11 5 (2.21%) Law
12 4 (1.77%) Advertising
12 4 (1.77%) Influencing Skills
12 4 (1.77%) Manufacturing
13 3 (1.33%) Front Office
13 3 (1.33%) Organisational Skills
14 2 (0.88%) Publishing
Job Titles
1 31 (13.72%) Senior
2 25 (11.06%) Developer
3 23 (10.18%) Designer
4 18 (7.96%) Lead
5 15 (6.64%) Consultant
6 13 (5.75%) User Experience Consultant
7 10 (4.42%) UI Designer
8 9 (3.98%) Analyst
8 9 (3.98%) Architect
8 9 (3.98%) Cryptography Engineer
9 8 (3.54%) Infrastructure Engineer
9 8 (3.54%) Technical Manager
9 8 (3.54%) Tester
9 8 (3.54%) UX Designer
10 7 (3.10%) Applications Support
10 7 (3.10%) Front-End Engineer (Client-Side Engineer)
10 7 (3.10%) QA Engineer
10 7 (3.10%) Senior Designer
10 7 (3.10%) Senior Front-End Engineer (Client-Side Engineer)
11 6 (2.65%) Senior UI Designer
Libraries, Frameworks & Software Standards
1 40 (17.70%) HTML
2 34 (15.04%) CSS
3 24 (10.62%) REST
4 18 (7.96%) .NET
5 17 (7.52%) Node.js
5 17 (7.52%) React
6 15 (6.64%) RESTful
7 14 (6.19%) .NET Framework
8 9 (3.98%) Gherkin
8 9 (3.98%) Web Services
9 8 (3.54%) LDAP
10 7 (3.10%) GraphQL
11 6 (2.65%) Flutter
11 6 (2.65%) Lucene
11 6 (2.65%) NativeScript
11 6 (2.65%) React Native
11 6 (2.65%) Redux
12 5 (2.21%) AngularJS
13 4 (1.77%) Play Framework
14 3 (1.33%) Kafka
Miscellaneous
1 19 (8.41%) Product Ownership
2 17 (7.52%) Self-Motivation
3 14 (6.19%) Greenfield Project
4 13 (5.75%) Management Information System
4 13 (5.75%) Mobile App
5 9 (3.98%) Virtual Team
6 8 (3.54%) Public Cloud
7 7 (3.10%) Driving Licence
7 7 (3.10%) FMCG
7 7 (3.10%) Social Media
8 6 (2.65%) Cloud Native
8 6 (2.65%) Reinsurance
9 5 (2.21%) Distributed Systems
9 5 (2.21%) NHS
10 4 (1.77%) Distributed Applications
10 4 (1.77%) Marketing Technology
10 4 (1.77%) Renewable Energy
11 3 (1.33%) Fixed Income
11 3 (1.33%) Foreign Exchange (FX)
11 3 (1.33%) Graphic Design
Operating Systems
1 28 (12.39%) Windows
2 18 (7.96%) Linux
3 15 (6.64%) Unix
4 9 (3.98%) Windows Server
5 7 (3.10%) Solaris
6 5 (2.21%) Apple iOS
7 4 (1.77%) Android
7 4 (1.77%) Mac OS
Processes & Methodologies
1 75 (33.19%) Agile
2 52 (23.01%) User Experience
3 45 (19.91%) Problem-Solving
4 41 (18.14%) DevOps
5 31 (13.72%) User-Centered Design (UCD)
6 27 (11.95%) Actionable Insight
7 26 (11.50%) User Research
8 25 (11.06%) Wireframes
9 24 (10.62%) Software Engineering
10 22 (9.73%) Analytics
10 22 (9.73%) Visualisation
11 21 (9.29%) Project Delivery
11 21 (9.29%) UX Design
12 20 (8.85%) CI/CD
13 19 (8.41%) Computer Science
14 18 (7.96%) API Testing
14 18 (7.96%) Data Visualisation
14 18 (7.96%) High-Fidelity Prototypes
14 18 (7.96%) Low-Fidelity Prototypes
14 18 (7.96%) Test Automation
Programming Languages
1 33 (14.60%) SQL
2 28 (12.39%) C#
3 27 (11.95%) JavaScript
4 17 (7.52%) Python
5 15 (6.64%) TypeScript
6 10 (4.42%) Java
6 10 (4.42%) Rust
7 7 (3.10%) Shell Script
8 6 (2.65%) Dart
9 4 (1.77%) Data Analysis Expressions
9 4 (1.77%) Scala
10 3 (1.33%) Bash
10 3 (1.33%) PowerShell
11 2 (0.88%) T-SQL
11 2 (0.88%) X++
12 1 (0.44%) Groovy
12 1 (0.44%) Kotlin
12 1 (0.44%) Perl
12 1 (0.44%) PHP
12 1 (0.44%) Solidity
Qualifications
1 53 (23.45%) Degree
2 26 (11.50%) Security Cleared
3 17 (7.52%) Microsoft Certification
4 13 (5.75%) SC Cleared
5 6 (2.65%) Oracle Certification
6 4 (1.77%) BPSS Clearance
6 4 (1.77%) Computer Science Degree
6 4 (1.77%) Master's Degree
7 3 (1.33%) AWS Certification
7 3 (1.33%) AWS Certified Solutions Architect
7 3 (1.33%) ISEB
7 3 (1.33%) ISTQB
8 2 (0.88%) Azure Certification
8 2 (0.88%) ISTQB Foundation Certification
9 1 (0.44%) DBS Check
Quality Assurance & Compliance
1 32 (14.16%) WCAG
2 25 (11.06%) QA
3 10 (4.42%) Data Quality
4 9 (3.98%) GDPR
5 2 (0.88%) PMO
5 2 (0.88%) WAI
6 1 (0.44%) Actionable Recommendations
System Software
1 9 (3.98%) Active Directory
2 8 (3.54%) VMware Infrastructure
3 6 (2.65%) Docker
Systems Management
1 5 (2.21%) Kubernetes
2 3 (1.33%) Terraform
3 2 (0.88%) Microsoft Intune
4 1 (0.44%) Grafana
4 1 (0.44%) Prometheus
Vendors
1 61 (26.99%) Microsoft
2 26 (11.50%) Adobe
3 14 (6.19%) Google
4 13 (5.75%) NEC
4 13 (5.75%) Oracle
5 10 (4.42%) Cisco
6 9 (3.98%) VMware
7 8 (3.54%) Sitecore
8 6 (2.65%) Marketo
9 4 (1.77%) Mercator
9 4 (1.77%) Salesforce
10 2 (0.88%) Cadence
10 2 (0.88%) Forcepoint
10 2 (0.88%) Meraki
10 2 (0.88%) ServiceNow
11 1 (0.44%) Alteryx
11 1 (0.44%) Foundry
11 1 (0.44%) New Relic
11 1 (0.44%) Optimizely
11 1 (0.44%) Splunk