QA Jobs in London

Quality Assurance (QA)
England > London

The table below provides summary statistics for permanent job vacancies advertised in London requiring QA skills. It includes a benchmarking guide to the annual salaries offered in vacancies that cited QA over the 6 months leading up to 31 May 2025, comparing them to the same period in the previous two years.

6 months to
31 May 2025
Same period 2024 Same period 2023
Rank 70 83 43
Rank change year-on-year +13 -40 +8
Permanent jobs citing QA 532 827 1,975
As % of all permanent jobs advertised in London 4.16% 3.44% 6.14%
As % of the Quality Assurance & Compliance category 25.20% 24.48% 37.64%
Number of salaries quoted 375 620 1,189
10th Percentile £29,575 £39,950 £43,750
25th Percentile £47,500 £52,500 £52,500
Median annual salary (50th Percentile) £65,000 £67,500 £70,000
Median % change year-on-year -3.70% -3.57% +3.70%
75th Percentile £82,500 £95,000 £90,000
90th Percentile £102,250 £112,500 £102,500
England median annual salary £58,500 £52,500 £60,000
% change year-on-year +11.43% -12.50% -

All Quality Assurance and Compliance Skills
London

QA falls under the Quality Assurance and Compliance category. For comparison with the information above, the following table provides summary statistics for all permanent job vacancies requiring quality assurance or compliance skills in London.

Permanent vacancies with a requirement for quality assurance or compliance skills 2,111 3,378 5,247
As % of all permanent jobs advertised in London 16.52% 14.06% 16.30%
Number of salaries quoted 1,255 2,450 3,421
10th Percentile £41,250 £36,750 £39,748
25th Percentile £52,500 £51,250 £51,250
Median annual salary (50th Percentile) £70,000 £69,750 £67,500
Median % change year-on-year +0.36% +3.33% +3.85%
75th Percentile £90,000 £92,094 £85,000
90th Percentile £111,250 £112,500 £102,500
England median annual salary £60,000 £52,500 £57,500
% change year-on-year +14.29% -8.70% +4.55%

QA
Job Vacancy Trend in London

Job postings citing QA as a proportion of all IT jobs advertised in London.
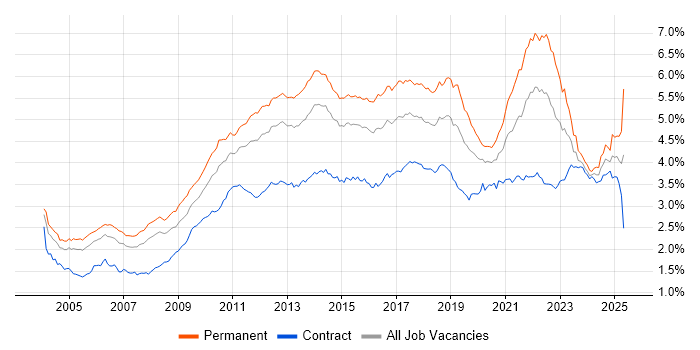
Job vacancy trend for QA in London

QA
Salary Trend in London

3-month moving average salary quoted in jobs citing QA in London.

Salary trend for QA in London

QA
Salary Histogram in London

Salary distribution for jobs citing QA in London over the 6 months to 31 May 2025.

Salary histogram for QA in London

QA
Job Locations in London

The table below looks at the demand and provides a guide to the median salaries quoted in IT jobs citing QA within the London region over the 6 months to 31 May 2025. The 'Rank Change' column provides an indication of the change in demand within each location based on the same 6 month period last year.

Location Rank Change
on Same Period
Last Year
Matching
Permanent
IT Job Ads
Median Salary
Past 6 Months
Median Salary
% Change
on Same Period
Last Year
Live
Jobs
Central London -17 85 £75,000 +5.26% 47
West London +10 18 £30,000 -64.71% 26
East London -33 4 £100,000 +53.85% 15
South London -39 3 £37,643 -37.26% 10
North London -15 2 £67,500 +68.75% 2
QA
England

QA
Co-occurring Skills and Capabilities in London by Category

The follow tables expand on the table above by listing co-occurrences grouped by category. The same employment type, locality and period is covered with up to 20 co-occurrences shown in each of the following categories:

Application Platforms
1 11 (2.07%) Confluence
2 9 (1.69%) SharePoint
3 6 (1.13%) CMS
3 6 (1.13%) nginx
4 5 (0.94%) Liferay
5 4 (0.75%) Apache Spark
5 4 (0.75%) Microsoft Exchange
6 3 (0.56%) Apache Airflow
6 3 (0.56%) Tomcat
7 2 (0.38%) Apache
7 2 (0.38%) CoreMedia CMS
8 1 (0.19%) Apache Solr
8 1 (0.19%) Drupal
8 1 (0.19%) Ethereum
8 1 (0.19%) Headless CMS
8 1 (0.19%) Skype for Business
Applications
1 24 (4.51%) Microsoft Excel
2 16 (3.01%) Microsoft Project
3 14 (2.63%) Microsoft Office
4 7 (1.32%) MS Visio
5 5 (0.94%) Microsoft PowerPoint
5 5 (0.94%) Trello
6 4 (0.75%) Adobe After Effects
6 4 (0.75%) Adobe Illustrator
6 4 (0.75%) Photoshop
7 1 (0.19%) AutoCAD
7 1 (0.19%) Revit
Business Applications
1 9 (1.69%) Dynamics NAV
2 8 (1.50%) Dynamics CRM
3 5 (0.94%) Elite 3E
4 4 (0.75%) Adobe Campaign
4 4 (0.75%) CA PPM
5 2 (0.38%) Payment Gateway
5 2 (0.38%) Salesforce CRM
6 1 (0.19%) Carpe Diem
6 1 (0.19%) Endur
6 1 (0.19%) Magento
6 1 (0.19%) Relativity
6 1 (0.19%) SAP S/4HANA
Cloud Services
1 108 (20.30%) Azure
2 69 (12.97%) AWS
3 39 (7.33%) GCP
4 30 (5.64%) Azure DevOps
5 29 (5.45%) GitHub
6 27 (5.08%) Serverless
7 22 (4.14%) Power Platform
8 20 (3.76%) AWS Lambda
9 15 (2.82%) GitHub Actions
10 13 (2.44%) Dynamics 365
11 12 (2.26%) Azure Data Factory
12 10 (1.88%) SaaS
13 9 (1.69%) Azure Synapse Analytics
13 9 (1.69%) PowerApps
14 8 (1.50%) Amazon S3
14 8 (1.50%) Azure Logic Apps
14 8 (1.50%) Power Automate
14 8 (1.50%) Smartsheet
15 7 (1.32%) Amazon ECS
16 6 (1.13%) Azure Functions
Communications & Networking
1 12 (2.26%) Multicast
2 10 (1.88%) Firewall
3 5 (0.94%) DNS
4 3 (0.56%) VLAN
5 2 (0.38%) Network Security
5 2 (0.38%) WAN
5 2 (0.38%) Wi-Fi
6 1 (0.19%) DHCP
6 1 (0.19%) Internet
6 1 (0.19%) Intranet
6 1 (0.19%) LAN
6 1 (0.19%) PBX
6 1 (0.19%) Skype
6 1 (0.19%) SSH
6 1 (0.19%) TCP/IP
6 1 (0.19%) Unified Communications
6 1 (0.19%) Value-Added Service
6 1 (0.19%) VoIP
6 1 (0.19%) VPN
6 1 (0.19%) Wireless
Database & Business Intelligence
1 26 (4.89%) PostgreSQL
2 24 (4.51%) Relational Database
3 23 (4.32%) Elasticsearch
4 20 (3.76%) NoSQL
5 19 (3.57%) MySQL
6 18 (3.38%) DynamoDB
6 18 (3.38%) Power BI
7 14 (2.63%) SQL Server
8 12 (2.26%) Data Lake
8 12 (2.26%) RDBMS
9 9 (1.69%) Tableau
10 8 (1.50%) Data Warehouse
10 8 (1.50%) MongoDB
11 7 (1.32%) Metadata
12 5 (0.94%) Delta Lake
13 4 (0.75%) Big Data
13 4 (0.75%) Redis
14 3 (0.56%) Azure SQL Database
14 3 (0.56%) SQL Server Integration Services
14 3 (0.56%) SQL Server Reporting Services
Development Applications
1 48 (9.02%) JIRA
2 44 (8.27%) Git
2 44 (8.27%) Selenium
3 20 (3.76%) Jenkins
3 20 (3.76%) Postman
4 15 (2.82%) GitLab
5 14 (2.63%) Cypress.io
6 12 (2.26%) Gradle
6 12 (2.26%) JMeter
6 12 (2.26%) SpecFlow
7 11 (2.07%) Appium
8 10 (1.88%) SoapUI
9 9 (1.69%) JUnit
9 9 (1.69%) TestNG
10 7 (1.32%) Maven
10 7 (1.32%) SonarQube
11 6 (1.13%) Cucumber
11 6 (1.13%) Mocha
11 6 (1.13%) MSTest
11 6 (1.13%) WebDriver
General
1 218 (40.98%) Social Skills
2 174 (32.71%) Finance
3 117 (21.99%) Analytical Skills
4 65 (12.22%) Marketing
5 55 (10.34%) Manufacturing
6 43 (8.08%) Inclusion and Diversity
7 40 (7.52%) Public Sector
8 38 (7.14%) Banking
9 37 (6.95%) Legal
10 30 (5.64%) Retail
11 29 (5.45%) Games
12 28 (5.26%) Publishing
12 28 (5.26%) Telecoms
13 25 (4.70%) Electronics
13 25 (4.70%) Organisational Skills
14 21 (3.95%) Health Technology
15 20 (3.76%) Law
16 17 (3.20%) Tech for Good
17 13 (2.44%) Presentation Skills
18 12 (2.26%) Pharmaceutical
Job Titles
1 125 (23.50%) Senior
2 118 (22.18%) Developer
3 69 (12.97%) Senior Developer
4 54 (10.15%) Lead
5 49 (9.21%) Analyst
6 37 (6.95%) QA Engineer
7 28 (5.26%) QA Officer
8 24 (4.51%) Support Manager
9 23 (4.32%) Software Engineer
10 22 (4.14%) Project Manager
10 22 (4.14%) Python Developer
10 22 (4.14%) Software Developer
11 21 (3.95%) Consultant
11 21 (3.95%) Front-End Developer (Client-Side Developer)
12 19 (3.57%) Business Analyst
12 19 (3.57%) Senior Front-End Developer
13 18 (3.38%) IT Manager
13 18 (3.38%) Senior Python Developer
13 18 (3.38%) Senior Software Developer
14 17 (3.20%) Senior Manager
Libraries, Frameworks & Software Standards
1 50 (9.40%) React
2 34 (6.39%) REST
3 30 (5.64%) RESTful
4 29 (5.45%) CSS
5 28 (5.26%) .NET
6 27 (5.08%) HTML
6 27 (5.08%) Swagger
7 23 (4.32%) Playwright
8 22 (4.14%) pytest
9 20 (3.76%) Node.js
10 16 (3.01%) FIX Protocol
11 15 (2.82%) Web Services
12 14 (2.63%) FastAPI
13 13 (2.44%) Next.js
14 10 (1.88%) Boost C++ Libraries
14 10 (1.88%) Flask
14 10 (1.88%) JSON
15 9 (1.69%) .NET Core
15 9 (1.69%) OAuth
16 8 (1.50%) OAuth2
Miscellaneous
1 33 (6.20%) Product Ownership
2 25 (4.70%) Cloud Native
2 25 (4.70%) Mobile Games
3 19 (3.57%) Algorithms
4 18 (3.38%) Fixed Income
5 17 (3.20%) Mobile App
6 16 (3.01%) Legacy Systems
7 14 (2.63%) Digital Media
8 12 (2.26%) Distributed Systems
8 12 (2.26%) Foreign Exchange (FX)
9 11 (2.07%) Derivative
9 11 (2.07%) Educational Technology
9 11 (2.07%) Management Information System
9 11 (2.07%) Self-Motivation
10 9 (1.69%) Data Structures
11 8 (1.50%) e-Learning
11 8 (1.50%) Equities
11 8 (1.50%) Hybrid Cloud
11 8 (1.50%) Social Media
11 8 (1.50%) Virtual Team
Operating Systems
1 42 (7.89%) Linux
2 27 (5.08%) Android
3 25 (4.70%) Apple iOS
4 16 (3.01%) Windows
5 11 (2.07%) Windows Server
6 7 (1.32%) CentOS
7 3 (0.56%) Embedded Linux
7 3 (0.56%) Rocky
8 1 (0.19%) Amazon Linux
8 1 (0.19%) Debian
8 1 (0.19%) Red Hat Enterprise Linux
8 1 (0.19%) Unix
Processes & Methodologies
1 180 (33.83%) Agile
2 150 (28.20%) Problem-Solving
3 118 (22.18%) DevOps
4 113 (21.24%) Project Management
5 108 (20.30%) Test Automation
6 97 (18.23%) CI/CD
7 76 (14.29%) Mentoring
8 62 (11.65%) Continuous Improvement
9 61 (11.47%) Computer Science
10 59 (11.09%) Scrum
11 56 (10.53%) Software Testing
12 51 (9.59%) Software Engineering
13 48 (9.02%) Project Delivery
14 43 (8.08%) ITIL
15 41 (7.71%) Front End Development
16 40 (7.52%) Process Improvement
16 40 (7.52%) Technical Leadership
17 39 (7.33%) Change Management
17 39 (7.33%) User Experience
18 38 (7.14%) Business Intelligence
Programming Languages
1 105 (19.74%) Python
2 86 (16.17%) SQL
3 62 (11.65%) Java
4 60 (11.28%) JavaScript
5 54 (10.15%) C#
6 50 (9.40%) TypeScript
7 20 (3.76%) Swift
8 18 (3.38%) Kotlin
9 17 (3.20%) Objective-C
10 16 (3.01%) C++
11 11 (2.07%) Bash
12 8 (1.50%) PowerShell
13 7 (1.32%) PHP
14 3 (0.56%) Embedded C++
14 3 (0.56%) Go
14 3 (0.56%) Ruby
14 3 (0.56%) Scala
14 3 (0.56%) Shell Script
14 3 (0.56%) T-SQL
15 2 (0.38%) Data Analysis Expressions
Qualifications
1 127 (23.87%) Degree
2 39 (7.33%) PMI Certification
3 38 (7.14%) Computer Science Degree
4 35 (6.58%) PMP
5 29 (5.45%) CISSP
6 28 (5.26%) ISTQB
7 19 (3.57%) Master's Degree
8 13 (2.44%) DBS Check
9 9 (1.69%) SC Cleared
9 9 (1.69%) Security Cleared
10 7 (1.32%) AWS Certification
10 7 (1.32%) Azure Certification
10 7 (1.32%) Cisco Certification
10 7 (1.32%) ISEB
11 5 (0.94%) (ISC)2 CCSP
11 5 (0.94%) AWS Certified Solutions Architect
11 5 (0.94%) CCSAS
11 5 (0.94%) CCSP
11 5 (0.94%) CISM
11 5 (0.94%) CSPO
Quality Assurance & Compliance
1 43 (8.08%) GMP
2 24 (4.51%) GDPR
3 17 (3.20%) Data Quality
3 17 (3.20%) PMO
4 15 (2.82%) Cyber Essentials
4 15 (2.82%) Cyber Essentials PLUS
5 11 (2.07%) Accessibility
5 11 (2.07%) Software Quality Assurance
6 8 (1.50%) ISO/IEC 27001
7 6 (1.13%) NIST
8 5 (0.94%) P3O
9 4 (0.75%) CDISC
9 4 (0.75%) PCI DSS
9 4 (0.75%) SLA
10 3 (0.56%) NCSC
11 2 (0.38%) Good Clinical Practice
11 2 (0.38%) ISO/IEC 17025
12 1 (0.19%) DICOM
12 1 (0.19%) GxP
12 1 (0.19%) HL7
System Software
1 43 (8.08%) Docker
2 7 (1.32%) Active Directory
3 3 (0.56%) VMware Infrastructure
Systems Management
1 35 (6.58%) Kubernetes
2 27 (5.08%) Terraform
3 14 (2.63%) Ansible
3 14 (2.63%) Prometheus
4 12 (2.26%) Grafana
5 8 (1.50%) Argo
6 7 (1.32%) Nagios
7 3 (0.56%) Kustomize
7 3 (0.56%) Red Hat Satellite
8 2 (0.38%) HP Quality Center
9 1 (0.19%) Check_MK
9 1 (0.19%) FortiGate
9 1 (0.19%) Istio
9 1 (0.19%) Kibana
9 1 (0.19%) logstash
9 1 (0.19%) Opsgenie
9 1 (0.19%) Proxmox
9 1 (0.19%) Single Sign-On
Vendors
1 44 (8.27%) Microsoft
2 30 (5.64%) SAP
3 29 (5.45%) Google
4 14 (2.63%) Adobe
5 12 (2.26%) New Relic
6 10 (1.88%) Salesforce
7 9 (1.69%) Databricks
8 8 (1.50%) IBM
8 8 (1.50%) Red Hat
8 8 (1.50%) SolarWinds
9 5 (0.94%) Planview
9 5 (0.94%) TikTok
10 4 (0.75%) iManage
10 4 (0.75%) Intapp
10 4 (0.75%) JD Edwards
10 4 (0.75%) Marketo
10 4 (0.75%) Pegasus
10 4 (0.75%) Rapid7
10 4 (0.75%) Splunk
11 3 (0.56%) Facebook