Microsoft Excel Jobs in London

Microsoft Excel
England > London

The table below provides summary statistics for permanent job vacancies advertised in London requiring Microsoft Excel skills. It includes a benchmarking guide to the annual salaries offered in vacancies that cited Microsoft Excel over the 6 months leading up to 26 July 2024, comparing them to the same period in the previous two years.

6 months to
26 Jul 2024
Same period 2023 Same period 2022
Rank 44 88 151
Rank change year-on-year +44 +63 +19
Permanent jobs citing Microsoft Excel 1,117 958 2,161
As % of all permanent jobs advertised in London 5.39% 3.53% 2.88%
As % of the Applications category 57.49% 43.51% 33.29%
Number of salaries quoted 426 557 1,141
10th Percentile £31,250 £32,500 £30,750
25th Percentile £40,000 £42,500 £41,250
Median annual salary (50th Percentile) £55,000 £57,500 £55,000
Median % change year-on-year -4.35% +4.55% +10.00%
75th Percentile £70,000 £72,500 £70,000
90th Percentile £81,875 £85,000 £91,250
England median annual salary £42,500 £42,500 £46,500
% change year-on-year - -8.60% +9.41%

All Software Application Skills
London

Microsoft Excel falls under the Software Applications category. For comparison with the information above, the following table provides summary statistics for all permanent job vacancies requiring software application skills in London.

Permanent vacancies with a requirement for software application skills 1,943 2,202 6,491
As % of all permanent jobs advertised in London 9.37% 8.12% 8.65%
Number of salaries quoted 1,020 1,535 2,839
10th Percentile £30,000 £31,250 £30,000
25th Percentile £36,750 £38,000 £37,505
Median annual salary (50th Percentile) £52,500 £55,000 £55,000
Median % change year-on-year -4.55% - +1.85%
75th Percentile £70,000 £72,000 £70,000
90th Percentile £85,000 £87,500 £86,250
England median annual salary £40,450 £45,000 £45,000
% change year-on-year -10.11% - -

Microsoft Excel
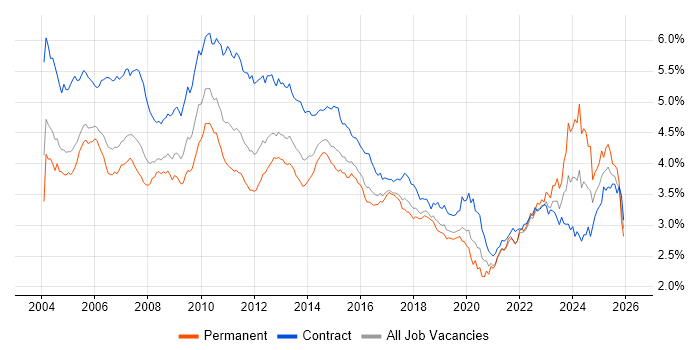
Job Vacancy Trend in London

Job postings citing Microsoft Excel as a proportion of all IT jobs advertised in London.

Job vacancy trend for Microsoft Excel in London

Microsoft Excel
Salary Trend in London

3-month moving average salary quoted in jobs citing Microsoft Excel in London.

Salary trend for Microsoft Excel in London

Microsoft Excel
Salary Histogram in London

Salary distribution for jobs citing Microsoft Excel in London over the 6 months to 26 July 2024.

Salary histogram for Microsoft Excel in London

Microsoft Excel
Job Locations in London

The table below looks at the demand and provides a guide to the median salaries quoted in IT jobs citing Microsoft Excel within the London region over the 6 months to 26 July 2024. The 'Rank Change' column provides an indication of the change in demand within each location based on the same 6 month period last year.

Location Rank Change
on Same Period
Last Year
Matching
Permanent
IT Job Ads
Median Salary
Past 6 Months
Median Salary
% Change
on Same Period
Last Year
Live
Jobs
South London +48 285 £50,000 +47.06% 8
Central London +44 150 £52,433 -4.67% 48
West London +23 133 £32,500 -43.48% 26
North London +7 7 £65,000 +18.18% 9
East London +18 5 £41,000 +21.48% 14
Microsoft Excel
England

Microsoft Excel
Co-occurring Skills and Capabilities in London by Category

The follow tables expand on the table above by listing co-occurrences grouped by category. The same employment type, locality and period is covered with up to 20 co-occurrences shown in each of the following categories:

Application Platforms
1 63 (5.64%) SharePoint
2 12 (1.07%) Microsoft Exchange
3 11 (0.98%) SAS
4 9 (0.81%) Confluence
5 5 (0.45%) Apache Spark
6 4 (0.36%) Apache Airflow
7 3 (0.27%) CMS
7 3 (0.27%) IBM Notes
8 2 (0.18%) Skype for Business
9 1 (0.090%) Alfresco
9 1 (0.090%) Apache
9 1 (0.090%) Documentum
9 1 (0.090%) WordPress
Applications
1 297 (26.59%) Microsoft PowerPoint
2 271 (24.26%) Microsoft Office
3 35 (3.13%) Microsoft Project
4 32 (2.86%) MS Visio
5 12 (1.07%) Spreadsheet
5 12 (1.07%) SPSS
6 8 (0.72%) Adobe Creative Suite
7 5 (0.45%) Trello
8 4 (0.36%) InDesign
9 3 (0.27%) Photoshop
10 2 (0.18%) Adobe Captivate
10 2 (0.18%) Adobe Premiere
11 1 (0.090%) Adobe Illustrator
11 1 (0.090%) AutoCAD
11 1 (0.090%) Revit
11 1 (0.090%) UserZoom
Business Applications
1 7 (0.63%) Relativity
2 5 (0.45%) Elite 3E
3 4 (0.36%) Dynamics CRM
3 4 (0.36%) NEC Housing
3 4 (0.36%) Primavera
4 3 (0.27%) SAP Travel Management
5 2 (0.18%) Dynamics NAV
5 2 (0.18%) Eloqua
5 2 (0.18%) Endur
5 2 (0.18%) Fidessa
5 2 (0.18%) IBM Planning Analytics
5 2 (0.18%) SAP R/3
5 2 (0.18%) Veritas eDiscovery
6 1 (0.090%) Aladdin
6 1 (0.090%) Eikon
6 1 (0.090%) Finacle
6 1 (0.090%) Infor SunSystems
6 1 (0.090%) Markit EDM
6 1 (0.090%) Raiser’s Edge
6 1 (0.090%) Salesforce CRM
Cloud Services
1 215 (19.25%) Power Platform
2 73 (6.54%) Azure
3 36 (3.22%) AWS
3 36 (3.22%) Microsoft 365
4 21 (1.88%) Google Sheets
5 20 (1.79%) SaaS
6 15 (1.34%) Power Automate
7 14 (1.25%) GCP
8 12 (1.07%) Google Analytics
9 11 (0.98%) GitHub
9 11 (0.98%) PowerApps
9 11 (0.98%) Snowflake
10 9 (0.81%) Azure DevOps
11 8 (0.72%) Azure Data Factory
11 8 (0.72%) Google Workspace
11 8 (0.72%) OneDrive
12 7 (0.63%) Figma
12 7 (0.63%) PaaS
13 5 (0.45%) Dynamics 365
13 5 (0.45%) Google Data Studio
Communications & Networking
1 223 (19.96%) Broadband
2 11 (0.98%) Wireless
3 10 (0.90%) Firewall
4 7 (0.63%) LAN
4 7 (0.63%) WAN
5 5 (0.45%) DNS
6 4 (0.36%) Intranet
6 4 (0.36%) TCP/IP
7 3 (0.27%) DHCP
7 3 (0.27%) VPN
8 2 (0.18%) FIX Connectivity
8 2 (0.18%) Internet
8 2 (0.18%) Skype
8 2 (0.18%) WebEx
8 2 (0.18%) Wi-Fi
9 1 (0.090%) ISDN
9 1 (0.090%) Network Security
9 1 (0.090%) Remote Desktop
9 1 (0.090%) SNMP
9 1 (0.090%) Structured Cabling
Database & Business Intelligence
1 210 (18.80%) Power BI
2 74 (6.62%) Tableau
3 62 (5.55%) SQL Server
4 26 (2.33%) Data Warehouse
5 23 (2.06%) Amazon QuickSight
6 22 (1.97%) SQL Server Integration Services
7 19 (1.70%) SQL Server Reporting Services
8 18 (1.61%) Data Mining
9 17 (1.52%) Big Data
10 16 (1.43%) Power Query
11 14 (1.25%) GIS
12 12 (1.07%) MS Access
13 10 (0.90%) Relational Database
14 9 (0.81%) Amazon Redshift
14 9 (0.81%) PowerPivot
15 8 (0.72%) Spotfire
16 7 (0.63%) Azure SQL Database
16 7 (0.63%) EDRMS
16 7 (0.63%) PostgreSQL
17 6 (0.54%) Data Lake
Development Applications
1 39 (3.49%) JIRA
2 18 (1.61%) Visual Studio
3 9 (0.81%) Git
4 7 (0.63%) Team Foundation Server
5 6 (0.54%) RStudio
5 6 (0.54%) SoapUI
5 6 (0.54%) SQL Server Management Studio (SSMS)
6 4 (0.36%) Mercurial
6 4 (0.36%) PyCharm
6 4 (0.36%) Visual Studio Code
7 2 (0.18%) Bitbucket
7 2 (0.18%) Jenkins
8 1 (0.090%) Postman
8 1 (0.090%) Visual Studio Team System
General
1 761 (68.13%) Social Skills
2 562 (50.31%) Analytical Skills
3 530 (47.45%) Finance
4 241 (21.58%) Influencing Skills
5 188 (16.83%) Retail
6 138 (12.35%) Legal
7 134 (12.00%) German Language
8 122 (10.92%) Organisational Skills
9 95 (8.50%) Marketing
10 63 (5.64%) Presentation Skills
11 62 (5.55%) Inclusion and Diversity
12 46 (4.12%) Law
13 34 (3.04%) Banking
14 25 (2.24%) Back Office
15 23 (2.06%) Pharmaceutical
16 21 (1.88%) Public Sector
17 20 (1.79%) Advertising
18 12 (1.07%) French Language
18 12 (1.07%) Front Office
19 11 (0.98%) Publishing
Job Titles
1 506 (45.30%) Analyst
2 219 (19.61%) Senior
3 187 (16.74%) Senior Analyst
4 124 (11.10%) Graduate
5 104 (9.31%) Financial Analyst
6 75 (6.71%) Data Analyst
7 65 (5.82%) Commercial Analyst
8 63 (5.64%) Coordinator
9 57 (5.10%) Project Manager
10 47 (4.21%) Administrator
11 27 (2.42%) Senior Financial Analyst
12 25 (2.24%) Business Analyst
13 24 (2.15%) Consultant
14 22 (1.97%) Business Manager
15 21 (1.88%) Developer
15 21 (1.88%) Senior Data Analyst
16 20 (1.79%) Lead
16 20 (1.79%) Support Analyst
17 17 (1.52%) Data Engineer
18 16 (1.43%) Data Manager
Libraries, Frameworks & Software Standards
1 16 (1.43%) .NET
2 11 (0.98%) JSON
3 10 (0.90%) XML
4 8 (0.72%) .NET Framework
5 7 (0.63%) HTML
6 6 (0.54%) CSS
6 6 (0.54%) REST
6 6 (0.54%) SOAP
6 6 (0.54%) Web Services
6 6 (0.54%) WSDL
6 6 (0.54%) XML Messaging
6 6 (0.54%) XSD
7 5 (0.45%) PySpark
8 4 (0.36%) EDI
8 4 (0.36%) pyodbc
8 4 (0.36%) SQLAlchemy
8 4 (0.36%) XSLT
9 3 (0.27%) SAP TM
10 2 (0.18%) ADO
10 2 (0.18%) React
Miscellaneous
1 211 (18.89%) Self-Motivation
2 138 (12.35%) Driving Licence
3 87 (7.79%) Onboarding
4 81 (7.25%) Management Information System
5 22 (1.97%) Social Media
6 17 (1.52%) Data Structures
7 15 (1.34%) Reinsurance
8 14 (1.25%) Digital Media
9 12 (1.07%) Blog
9 12 (1.07%) Life Science
10 11 (0.98%) Equities
10 11 (0.98%) Fixed Income
11 10 (0.90%) Foreign Exchange (FX)
11 10 (0.90%) Robotics
11 10 (0.90%) Video Conferencing
12 9 (0.81%) Enterprise Software
12 9 (0.81%) Product Ownership
13 8 (0.72%) Data Centre
13 8 (0.72%) Derivative
13 8 (0.72%) Renewable Energy
Operating Systems
1 57 (5.10%) Windows
2 14 (1.25%) Windows Server
3 13 (1.16%) Windows 10
4 7 (0.63%) Linux
4 7 (0.63%) Unix
5 4 (0.36%) Windows Server 2016
6 2 (0.18%) Apple iOS
6 2 (0.18%) CentOS
6 2 (0.18%) Solaris
6 2 (0.18%) Ubuntu
7 1 (0.090%) Android
7 1 (0.090%) Mac OS
Processes & Methodologies
1 331 (29.63%) Agile
2 299 (26.77%) Decision-Making
3 253 (22.65%) Actionable Insight
3 253 (22.65%) Problem-Solving
4 233 (20.86%) Business Case
5 231 (20.68%) Mentoring
6 227 (20.32%) Budgeting
7 226 (20.23%) Budgeting and Forecasting
8 219 (19.61%) Business Intelligence
9 130 (11.64%) Analytics
10 127 (11.37%) Customer Insight
11 126 (11.28%) Project Management
12 116 (10.38%) Data Analysis
13 87 (7.79%) Time Management
14 81 (7.25%) Visualisation
15 64 (5.73%) Data Management
16 63 (5.64%) Data Visualisation
17 58 (5.19%) Customer Service
17 58 (5.19%) Mathematics
18 56 (5.01%) Continuous Improvement
Programming Languages
1 258 (23.10%) SQL
2 107 (9.58%) Python
3 60 (5.37%) VBA
4 37 (3.31%) T-SQL
5 30 (2.69%) R
6 22 (1.97%) PowerShell
7 15 (1.34%) Data Analysis Expressions
8 14 (1.25%) C#
9 11 (0.98%) JavaScript
10 6 (0.54%) Bash
11 5 (0.45%) Java
11 5 (0.45%) VB
12 4 (0.36%) Scala
13 3 (0.27%) PL/SQL
14 2 (0.18%) MATLAB
14 2 (0.18%) Perl
14 2 (0.18%) Ruby
14 2 (0.18%) VB.NET
15 1 (0.090%) Formula Language
15 1 (0.090%) VB6
Qualifications
1 391 (35.00%) Degree
2 237 (21.22%) ACCA
3 230 (20.59%) CIMA
4 147 (13.16%) DBS Check
5 26 (2.33%) Master's Degree
6 17 (1.52%) MRICS
7 12 (1.07%) PMI Certification
8 9 (0.81%) Computer Science Degree
8 9 (0.81%) MBA
8 9 (0.81%) Security Cleared
9 8 (0.72%) ITIL Certification
9 8 (0.72%) Numerate Degree
9 8 (0.72%) PMP
10 6 (0.54%) PRINCE2 Certification
10 6 (0.54%) Six Sigma Black Belt
11 5 (0.45%) A+ Certification
12 4 (0.36%) CISSP
12 4 (0.36%) HNC
12 4 (0.36%) MCP
12 4 (0.36%) MCSE
Quality Assurance & Compliance
1 64 (5.73%) Data Quality
2 43 (3.85%) QA
3 21 (1.88%) PMO
4 13 (1.16%) GDPR
5 11 (0.98%) IFRS
6 8 (0.72%) COBIT
7 5 (0.45%) ISO/IEC 27001
8 4 (0.36%) ISO 9001
8 4 (0.36%) SLA
9 2 (0.18%) IFRS 9
9 2 (0.18%) NIST
9 2 (0.18%) Sarbanes-Oxley
10 1 (0.090%) Accessibility
10 1 (0.090%) Actionable Recommendations
10 1 (0.090%) COREP
10 1 (0.090%) FINREP
10 1 (0.090%) GRC
10 1 (0.090%) ISO 20022
10 1 (0.090%) P3O
10 1 (0.090%) SEPA
System Software
1 6 (0.54%) Active Directory
2 3 (0.27%) Docker
2 3 (0.27%) VMware Infrastructure
3 2 (0.18%) Hyper-V
3 2 (0.18%) Virtual Desktop
4 1 (0.090%) vSphere
Systems Management
1 9 (0.81%) Microsoft Intune
2 7 (0.63%) Control-M
3 3 (0.27%) Ansible
4 1 (0.090%) Grafana
4 1 (0.090%) Kubernetes
4 1 (0.090%) SCCM
4 1 (0.090%) Terraform
4 1 (0.090%) ZABBIX
Vendors
1 626 (56.04%) Microsoft
2 45 (4.03%) Google
3 28 (2.51%) Oracle
4 24 (2.15%) Alteryx
5 20 (1.79%) Salesforce
6 17 (1.52%) Adobe
7 15 (1.34%) Databricks
7 15 (1.34%) SAP
8 9 (0.81%) Cadence
8 9 (0.81%) NEC
9 8 (0.72%) Bloomberg
10 7 (0.63%) Nuix
10 7 (0.63%) Remedy
11 6 (0.54%) Aderant
11 6 (0.54%) Cisco
11 6 (0.54%) Minitab
11 6 (0.54%) Palo Alto
11 6 (0.54%) VMware
12 5 (0.45%) Hyperion
12 5 (0.45%) IBM