Red Hat Jobs in London

Red Hat
England > London

The table below provides summary statistics for permanent job vacancies advertised in London requiring knowledge or experience of Red Hat products and/or services. It includes a benchmarking guide to the annual salaries offered in vacancies that cited Red Hat over the 6 months leading up to 23 May 2025, comparing them to the same period in the previous two years.

The figures below represent the IT labour market in general and are not representative of salaries within Red Hat, Inc.

6 months to
23 May 2025
Same period 2024 Same period 2023
Rank 288 327 351
Rank change year-on-year +39 +24 +153
Permanent jobs citing Red Hat 107 184 295
As % of all permanent jobs advertised in London 0.85% 0.78% 0.88%
As % of the Vendors category 2.03% 1.95% 2.24%
Number of salaries quoted 67 112 181
10th Percentile £46,600 £49,170 £50,000
25th Percentile £55,625 £63,750 £57,500
Median annual salary (50th Percentile) £72,500 £82,500 £70,000
Median % change year-on-year -12.12% +17.86% -
75th Percentile £81,875 £96,250 £90,000
90th Percentile £90,000 £102,500 £165,000
England median annual salary £65,000 £60,000 £62,500
% change year-on-year +8.33% -4.00% +4.17%

All Vendors
London

Red Hat falls under the Vendor Products and Services category. For comparison with the information above, the following table provides summary statistics for all permanent job vacancies requiring knowledge or experience of all vendor products and services in London.

Permanent vacancies with a requirement for knowledge or experience of vendor products and services 5,266 9,430 13,158
As % of all permanent jobs advertised in London 41.81% 39.91% 39.44%
Number of salaries quoted 3,039 6,496 9,105
10th Percentile £38,500 £35,500 £37,500
25th Percentile £51,250 £47,500 £50,000
Median annual salary (50th Percentile) £70,000 £67,500 £67,500
Median % change year-on-year +3.70% - +3.85%
75th Percentile £90,000 £87,500 £87,500
90th Percentile £110,000 £106,250 £103,750
England median annual salary £55,000 £50,000 £57,500
% change year-on-year +10.00% -13.04% +4.55%

Red Hat
Job Vacancy Trend in London

Job postings citing Red Hat as a proportion of all IT jobs advertised in London.

Job vacancy trend for Red Hat in London

Red Hat
Salary Trend in London

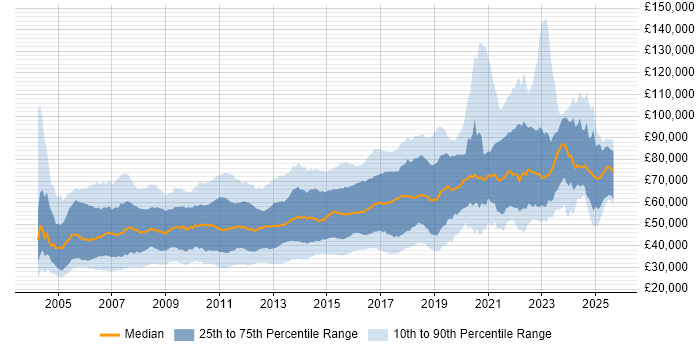
3-month moving average salary quoted in jobs citing Red Hat in London.

Salary trend for Red Hat in London

Red Hat
Salary Histogram in London

Salary distribution for jobs citing Red Hat in London over the 6 months to 23 May 2025.

Salary histogram for Red Hat in London

Red Hat
Job Locations in London

The table below looks at the demand and provides a guide to the median salaries quoted in IT jobs citing Red Hat within the London region over the 6 months to 23 May 2025. The 'Rank Change' column provides an indication of the change in demand within each location based on the same 6 month period last year.

Location Rank Change
on Same Period
Last Year
Matching
Permanent
IT Job Ads
Median Salary
Past 6 Months
Median Salary
% Change
on Same Period
Last Year
Live
Jobs
Central London +28 21 £77,500 -10.14% 1
South London -1 7 £75,000 +20.00% 4
East London -10 6 £68,750 +44.74% 1
West London - 5 £49,000 - 7
Red Hat
England

Red Hat
Co-occurring Skills and Capabilities in London by Category

The follow tables expand on the table above by listing co-occurrences grouped by category. The same employment type, locality and period is covered with up to 20 co-occurrences shown in each of the following categories:

Application Platforms
1 8 (7.48%) nginx
2 6 (5.61%) Microsoft Exchange
2 6 (5.61%) Tomcat
3 3 (2.80%) Apache
3 3 (2.80%) IIS
3 3 (2.80%) SharePoint
3 3 (2.80%) WinCC
4 2 (1.87%) Confluence
5 1 (0.93%) Apache Spark
5 1 (0.93%) Drupal
5 1 (0.93%) Oracle SOA Suite
Applications
1 3 (2.80%) Microsoft Excel
Business Applications
1 5 (4.67%) Fidessa
2 3 (2.80%) Remedy ITSM
Cloud Services
1 38 (35.51%) AWS
2 32 (29.91%) Azure
3 12 (11.21%) GitHub
4 7 (6.54%) GCP
5 6 (5.61%) Cloud Computing
5 6 (5.61%) OpenShift
5 6 (5.61%) PaaS
6 5 (4.67%) Amazon CloudWatch
6 5 (4.67%) Amazon ECR
6 5 (4.67%) Amazon ECS
6 5 (4.67%) Azure DevOps
6 5 (4.67%) Azure ExpressRoute
6 5 (4.67%) GitHub Actions
7 3 (2.80%) Amazon ElastiCache
7 3 (2.80%) Amazon OpenSearch
7 3 (2.80%) Amazon SQS
7 3 (2.80%) Microsoft 365
8 1 (0.93%) Amazon S3
8 1 (0.93%) Datadog
8 1 (0.93%) Entra ID
Communications & Networking
1 22 (20.56%) TCP/IP
2 16 (14.95%) Firewall
3 14 (13.08%) DNS
4 9 (8.41%) DHCP
5 7 (6.54%) LAN
6 5 (4.67%) FIX Connectivity
6 5 (4.67%) VPN
6 5 (4.67%) WAN
7 4 (3.74%) SAN
7 4 (3.74%) VLAN
8 3 (2.80%) Cisco ASA
8 3 (2.80%) Multicast
8 3 (2.80%) Telnet
8 3 (2.80%) Unified Communications
9 2 (1.87%) Fibre Channel
9 2 (1.87%) HTTP
9 2 (1.87%) Wireless
10 1 (0.93%) BGP
10 1 (0.93%) EIGRP
10 1 (0.93%) Internet
Database & Business Intelligence
1 16 (14.95%) PostgreSQL
2 12 (11.21%) DB2
2 12 (11.21%) MongoDB
2 12 (11.21%) NoSQL
3 10 (9.35%) SQL Server
4 9 (8.41%) MySQL
5 7 (6.54%) Elasticsearch
6 5 (4.67%) Amazon RDS
7 4 (3.74%) Amazon Aurora
7 4 (3.74%) Relational Database
8 1 (0.93%) Hadoop
8 1 (0.93%) NonStop SQL
8 1 (0.93%) Pentaho
8 1 (0.93%) Tableau
Development Applications
1 26 (24.30%) Git
2 4 (3.74%) Bitbucket
2 4 (3.74%) GitLab
2 4 (3.74%) Jenkins
2 4 (3.74%) SonarQube
3 3 (2.80%) Cucumber
3 3 (2.80%) JUnit
3 3 (2.80%) Maven
3 3 (2.80%) Mockito
3 3 (2.80%) Postman
3 3 (2.80%) Selenium
3 3 (2.80%) TestNG
4 2 (1.87%) JIRA
5 1 (0.93%) Octopus Deploy
General
1 50 (46.73%) Finance
2 26 (24.30%) Public Sector
3 24 (22.43%) Banking
4 22 (20.56%) Inclusion and Diversity
5 19 (17.76%) Social Skills
6 16 (14.95%) Analytical Skills
7 4 (3.74%) Manufacturing
8 3 (2.80%) Back Office
8 3 (2.80%) Presentation Skills
8 3 (2.80%) Spanish Language
8 3 (2.80%) Telecoms
9 1 (0.93%) Financial Institution
9 1 (0.93%) Front Office
9 1 (0.93%) Investment Banking
9 1 (0.93%) Military
Job Titles
1 26 (24.30%) Senior
2 21 (19.63%) DevOps Engineer
3 16 (14.95%) Administrator
3 16 (14.95%) Azure Engineer
3 16 (14.95%) Linux Administrator
4 13 (12.15%) AWS Engineer
4 13 (12.15%) Linux Engineer
5 12 (11.21%) AWS DevOps
5 12 (11.21%) AWS DevOps Engineer
5 12 (11.21%) Linux Support
6 11 (10.28%) Full-Stack Engineer
6 11 (10.28%) Linux Systems Administrator
6 11 (10.28%) Platform Engineer
6 11 (10.28%) Senior AWS DevOps Engineer
6 11 (10.28%) Senior DevOps
6 11 (10.28%) Senior DevOps Engineer
7 10 (9.35%) Systems Administrator
8 9 (8.41%) Infrastructure Engineer
9 8 (7.48%) Analyst
10 7 (6.54%) Support Analyst
Libraries, Frameworks & Software Standards
1 13 (12.15%) AngularJS
2 12 (11.21%) Backbone.js
2 12 (11.21%) Bootstrap
2 12 (11.21%) Ember.js
2 12 (11.21%) jQuery
2 12 (11.21%) React
3 8 (7.48%) FIX Protocol
4 7 (6.54%) REST
5 5 (4.67%) Kafka
6 4 (3.74%) Elastic Stack
7 3 (2.80%) Gherkin
7 3 (2.80%) Guice
7 3 (2.80%) JAX-RS
7 3 (2.80%) LEMP Stack
7 3 (2.80%) Mustache
7 3 (2.80%) Node.js
7 3 (2.80%) RESTful
7 3 (2.80%) Spring
7 3 (2.80%) Spring Boot
7 3 (2.80%) WireMock
Miscellaneous
1 23 (21.50%) Hybrid Cloud
2 22 (20.56%) e-Learning
3 12 (11.21%) Algorithms
3 12 (11.21%) Clustering
3 12 (11.21%) Data Structures
4 10 (9.35%) Management Information System
5 8 (7.48%) Data Centre
6 7 (6.54%) Equities
6 7 (6.54%) Fixed Income
7 6 (5.61%) Derivative
8 5 (4.67%) Eurex
9 4 (3.74%) Bitcoin
9 4 (3.74%) Replication
9 4 (3.74%) SCADA
10 3 (2.80%) Life Science
10 3 (2.80%) Onboarding
10 3 (2.80%) Public Cloud
10 3 (2.80%) Reference Data
11 2 (1.87%) Security Posture
11 2 (1.87%) Self-Motivation
Operating Systems
1 84 (78.50%) Linux
2 41 (38.32%) Red Hat Enterprise Linux
3 26 (24.30%) Windows
4 23 (21.50%) Unix
5 21 (19.63%) CentOS
6 12 (11.21%) Android
6 12 (11.21%) Apple iOS
7 10 (9.35%) Rocky
8 8 (7.48%) Solaris
9 7 (6.54%) Windows Server
10 3 (2.80%) Debian
10 3 (2.80%) Ubuntu
10 3 (2.80%) Windows Server 2019
11 1 (0.93%) Amazon Linux
11 1 (0.93%) CoreOS
11 1 (0.93%) VMS
11 1 (0.93%) Windows 7
11 1 (0.93%) Windows Server 2008
11 1 (0.93%) zOS
Processes & Methodologies
1 59 (55.14%) DevOps
2 29 (27.10%) CI/CD
3 23 (21.50%) Artificial Intelligence
3 23 (21.50%) Problem-Solving
4 22 (20.56%) Coaching
4 22 (20.56%) Mentoring
5 19 (17.76%) ITIL
6 18 (16.82%) Infrastructure as Code
7 15 (14.02%) Agile
8 14 (13.08%) Code Quality
8 14 (13.08%) Disaster Recovery
9 13 (12.15%) Configuration Management
10 12 (11.21%) Co-Creation
10 12 (11.21%) Design Thinking
10 12 (11.21%) User Experience
11 11 (10.28%) Capacity Planning
11 11 (10.28%) Full-Stack Development
11 11 (10.28%) Infrastructure Engineering
11 11 (10.28%) Platform Engineering
11 11 (10.28%) Root Cause Analysis
Programming Languages
1 34 (31.78%) SQL
2 33 (30.84%) Python
3 31 (28.97%) Bash
4 12 (11.21%) Perl
5 8 (7.48%) PowerShell
6 6 (5.61%) Shell Script
7 5 (4.67%) Java
8 3 (2.80%) C#
8 3 (2.80%) C++
8 3 (2.80%) JavaScript
8 3 (2.80%) VB
9 1 (0.93%) COBOL
9 1 (0.93%) Go
9 1 (0.93%) R
Qualifications
1 13 (12.15%) Degree
2 7 (6.54%) RHCSA
3 6 (5.61%) RHCE
4 5 (4.67%) AWS Certification
4 5 (4.67%) Computer Science Degree
4 5 (4.67%) SC Cleared
4 5 (4.67%) Security Cleared
5 4 (3.74%) ITIL Certification
6 1 (0.93%) AWS Certified Solutions Architect
6 1 (0.93%) CCNA
6 1 (0.93%) CCNP
6 1 (0.93%) Cisco Certification
6 1 (0.93%) CompTIA Security+
6 1 (0.93%) Dell Certification
6 1 (0.93%) MCSA
6 1 (0.93%) Microsoft Certification
Quality Assurance & Compliance
1 8 (7.48%) GDPR
1 8 (7.48%) QA
1 8 (7.48%) Sarbanes-Oxley
2 7 (6.54%) SLA
3 2 (1.87%) ISO/IEC 27001
4 1 (0.93%) ISO 15022
4 1 (0.93%) ISO 20022
4 1 (0.93%) PMO
System Software
1 28 (26.17%) VMware Infrastructure
2 11 (10.28%) Docker
3 6 (5.61%) Active Directory
3 6 (5.61%) Veritas Cluster Server
4 5 (4.67%) Hyper-V
4 5 (4.67%) Virtual Desktop
4 5 (4.67%) vSphere
5 3 (2.80%) Virtual Machines
6 2 (1.87%) NFS
7 1 (0.93%) VMware ESXi
Systems Management
1 48 (44.86%) Ansible
2 31 (28.97%) Terraform
3 20 (18.69%) Kubernetes
4 15 (14.02%) Nagios
5 12 (11.21%) Grafana
6 9 (8.41%) Red Hat Satellite
7 7 (6.54%) Puppet
8 3 (2.80%) Active Directory Federation Services
8 3 (2.80%) Functional Safety
8 3 (2.80%) Kustomize
8 3 (2.80%) Microsoft Intune
8 3 (2.80%) Packer
8 3 (2.80%) Progress Chef
8 3 (2.80%) SCCM
9 1 (0.93%) Graylog
9 1 (0.93%) Prometheus
9 1 (0.93%) Proxmox
9 1 (0.93%) WSUS
Vendors
1 34 (31.78%) VMware
2 24 (22.43%) IBM
3 17 (15.89%) Cisco
4 12 (11.21%) SolarWinds
5 10 (9.35%) Microsoft
6 9 (8.41%) Oracle
7 8 (7.48%) Atlassian
8 7 (6.54%) Citrix
8 7 (6.54%) Symantec
9 6 (5.61%) Veritas
10 5 (4.67%) Bloomberg
10 5 (4.67%) CQG
10 5 (4.67%) ION Trading
10 5 (4.67%) Reuters
10 5 (4.67%) Splunk
10 5 (4.67%) Trayport
11 4 (3.74%) Dell
11 4 (3.74%) Patsystems
11 4 (3.74%) Pure Storage
11 4 (3.74%) Rapid7