Linux Jobs in the Midlands

Linux
England > Midlands

The following table provides summary statistics for permanent job vacancies advertised in the Midlands with a requirement for Linux skills. Included is a benchmarking guide to the salaries offered in vacancies that have cited Linux over the 6 months to 11 May 2024 with a comparison to the same period in the previous 2 years.

6 months to
11 May 2024
Same period 2023 Same period 2022
Rank 51 65 33
Rank change year-on-year +14 -32 -8
Permanent jobs citing Linux 488 439 820
As % of all permanent jobs advertised in the Midlands 4.11% 4.75% 7.54%
As % of the Operating Systems category 30.69% 34.46% 39.54%
Number of salaries quoted 328 265 413
10th Percentile £30,925 £37,500 £32,500
25th Percentile £38,750 £42,500 £40,399
Median annual salary (50th Percentile) £50,000 £55,000 £52,500
Median % change year-on-year -9.09% +4.76% +10.53%
75th Percentile £58,750 £67,500 £62,500
90th Percentile £68,750 £80,000 £77,500
England median annual salary £56,504 £65,000 £60,000
% change year-on-year -13.07% +8.33% +4.35%

All Operating Systems
Midlands

Linux is in the Operating Systems category. The following table is for comparison with the above and provides summary statistics for all permanent job vacancies advertised in the Midlands with a requirement for operating system skills.

Permanent vacancies with a requirement for operating system skills 1,590 1,274 2,074
As % of all permanent jobs advertised in the Midlands 13.38% 13.78% 19.07%
Number of salaries quoted 1,303 845 1,446
10th Percentile £24,500 £25,500 £24,000
25th Percentile £26,750 £31,250 £30,000
Median annual salary (50th Percentile) £40,000 £45,000 £42,500
Median % change year-on-year -11.11% +5.88% +6.25%
75th Percentile £52,500 £57,500 £55,000
90th Percentile £61,250 £67,500 £67,500
England median annual salary £45,000 £52,500 £52,500
% change year-on-year -14.29% - +5.00%

Linux
Job Vacancy Trend in the Midlands

Job postings citing Linux as a proportion of all IT jobs advertised in the Midlands.
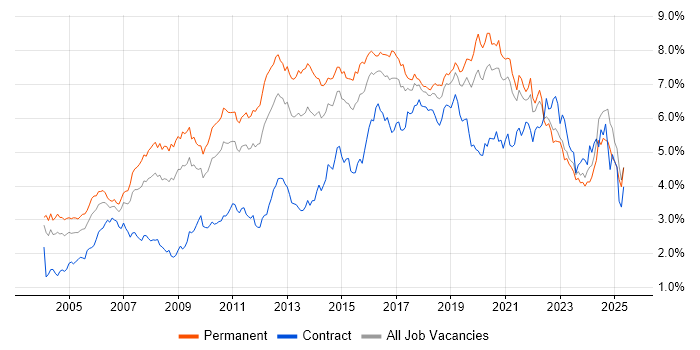
Job vacancy trend for Linux in the Midlands

Linux
Salary Trend in the Midlands

3-month moving average salary quoted in jobs citing Linux in the Midlands.

Salary trend for Linux in the Midlands

Linux
Salary Histogram in the Midlands

Salary distribution for jobs citing Linux in the Midlands over the 6 months to 11 May 2024.

Salary histogram for Linux in the Midlands

Linux
Job Locations in the Midlands

The table below looks at the demand and provides a guide to the median salaries quoted in IT jobs citing Linux within the Midlands region over the 6 months to 11 May 2024. The 'Rank Change' column provides an indication of the change in demand within each location based on the same 6 month period last year.

Location Rank Change
on Same Period
Last Year
Matching
Permanent
IT Job Ads
Median Salary
Past 6 Months
Median Salary
% Change
on Same Period
Last Year
Live
Jobs
East Midlands +23 281 £50,000 -9.09% 62
West Midlands -12 207 £54,000 -1.82% 58
Linux
England

Linux
Co-occurring Skills and Capabilities in the Midlands by Category

The follow tables expand on the table above by listing co-occurrences grouped by category. The same employment type, locality and period is covered with up to 20 co-occurrences shown in each of the following categories:

Application Platforms
1 25 (5.12%) Microsoft Exchange
2 15 (3.07%) Apache
2 15 (3.07%) nginx
3 13 (2.66%) SharePoint
4 12 (2.46%) IIS
5 10 (2.05%) WebLogic
5 10 (2.05%) WebSphere
6 8 (1.64%) Tomcat
7 4 (0.82%) Apache Spark
7 4 (0.82%) ArcGIS
7 4 (0.82%) GeoServer
8 3 (0.61%) MQSeries
8 3 (0.61%) Oracle HTTP Server
9 2 (0.41%) Exchange Server 2010
10 1 (0.20%) Drupal
10 1 (0.20%) JBoss
10 1 (0.20%) NetWeaver
10 1 (0.20%) SAP Portal
10 1 (0.20%) WebSphere Application Server
10 1 (0.20%) WordPress
Applications
1 6 (1.23%) Microsoft Office
2 2 (0.41%) CATIA
2 2 (0.41%) Microsoft Project
2 2 (0.41%) NASTRAN
3 1 (0.20%) Microsoft Excel
Business Applications
1 7 (1.43%) NEC Housing
2 4 (0.82%) NetSuite
2 4 (0.82%) Sparx Enterprise Architect
3 3 (0.61%) Maximo
4 2 (0.41%) Teamcenter
5 1 (0.20%) Magento
5 1 (0.20%) SAP CRM
5 1 (0.20%) SAP GRC
5 1 (0.20%) SAP MDG
5 1 (0.20%) SAP S/4HANA
5 1 (0.20%) Shopify
Cloud Services
1 184 (37.70%) Azure
2 72 (14.75%) AWS
3 71 (14.55%) IBM Cloud
4 44 (9.02%) Microsoft 365
5 34 (6.97%) Entra ID
6 17 (3.48%) GCP
7 16 (3.28%) Azure DevOps
7 16 (3.28%) GitHub
7 16 (3.28%) SaaS
8 9 (1.84%) Azure Logic Apps
9 8 (1.64%) Amazon S3
10 6 (1.23%) Amazon EKS
10 6 (1.23%) IaaS
10 6 (1.23%) PaaS
10 6 (1.23%) Serverless
11 5 (1.02%) Amazon SQS
11 5 (1.02%) GitHub Actions
11 5 (1.02%) Google Workspace
11 5 (1.02%) npm
12 4 (0.82%) Amazon EC2
Communications & Networking
1 69 (14.14%) Firewall
2 33 (6.76%) TCP/IP
3 31 (6.35%) DNS
4 24 (4.92%) DHCP
5 22 (4.51%) SAN
6 21 (4.30%) Internet
7 19 (3.89%) VLAN
8 16 (3.28%) VPN
9 13 (2.66%) Wi-Fi
10 9 (1.84%) Bluetooth
10 9 (1.84%) HTTP
10 9 (1.84%) LAN
11 8 (1.64%) 802.11
11 8 (1.64%) BGP
11 8 (1.64%) Wireless
11 8 (1.64%) Wireshark
12 7 (1.43%) IPsec
12 7 (1.43%) MQTT
12 7 (1.43%) WAN
13 6 (1.23%) Ethernet
Database & Business Intelligence
1 103 (21.11%) PostgreSQL
2 82 (16.80%) MongoDB
3 75 (15.37%) DB2
4 71 (14.55%) NoSQL
5 47 (9.63%) SQL Server
6 39 (7.99%) MySQL
7 26 (5.33%) Oracle Database
8 14 (2.87%) Relational Database
9 10 (2.05%) Amazon RDS
10 8 (1.64%) Elasticsearch
11 7 (1.43%) Ingres
11 7 (1.43%) SQL Server Integration Services
11 7 (1.43%) SQL Server Reporting Services
12 6 (1.23%) Data Warehouse
12 6 (1.23%) MariaDB
13 5 (1.02%) RDBMS
14 4 (0.82%) Big Data
14 4 (0.82%) GIS
14 4 (0.82%) QGIS
14 4 (0.82%) UniData
Development Applications
1 53 (10.86%) Git
2 27 (5.53%) JIRA
3 17 (3.48%) Visual Studio
4 16 (3.28%) Subversion
5 10 (2.05%) GNU Toolchain
6 7 (1.43%) Jenkins
7 5 (1.02%) gulp
7 5 (1.02%) webpack
8 4 (0.82%) GitLab
9 3 (0.61%) IBM UrbanCode
10 2 (0.41%) CANoe
10 2 (0.41%) GCC
10 2 (0.41%) Team Foundation Server
11 1 (0.20%) Bitbucket
11 1 (0.20%) Cucumber
11 1 (0.20%) MSBuild
11 1 (0.20%) PHPUnit
11 1 (0.20%) Selenium
11 1 (0.20%) Terragrunt
11 1 (0.20%) WiX
General
1 102 (20.90%) Social Skills
2 82 (16.80%) Public Sector
3 72 (14.75%) Inclusion and Diversity
4 58 (11.89%) Analytical Skills
5 42 (8.61%) Finance
6 34 (6.97%) Electronics
7 22 (4.51%) Law
8 21 (4.30%) Retail
9 15 (3.07%) Automotive
10 12 (2.46%) Manufacturing
11 10 (2.05%) Marketing
12 9 (1.84%) Local Government
13 7 (1.43%) Military
13 7 (1.43%) Police
14 6 (1.23%) Telecoms
15 5 (1.02%) iGaming
16 4 (0.82%) Aerospace
16 4 (0.82%) Games
16 4 (0.82%) Influencing Skills
17 3 (0.61%) Legal
Job Titles
1 79 (16.19%) Azure Engineer
2 77 (15.78%) Senior
3 71 (14.55%) Full Stack Engineer
4 66 (13.52%) Developer
5 53 (10.86%) Software Engineer
6 51 (10.45%) Administrator
7 49 (10.04%) Embedded Engineer
8 44 (9.02%) Infrastructure Engineer
9 34 (6.97%) Linux Engineer
10 31 (6.35%) DBA
11 30 (6.15%) Analyst
12 25 (5.12%) Systems Administrator
13 24 (4.92%) IT Engineer
13 24 (4.92%) Lead
14 23 (4.71%) Software Developer
15 22 (4.51%) Cloud Engineer
15 22 (4.51%) Support Engineer
16 21 (4.30%) Senior Software Engineer
17 19 (3.89%) IT Support
18 18 (3.69%) Embedded Software Engineer
Libraries, Frameworks & Software Standards
1 99 (20.29%) .NET
2 96 (19.67%) HTML
3 94 (19.26%) CSS
4 89 (18.24%) React
5 85 (17.42%) jQuery
6 83 (17.01%) Web Services
7 78 (15.98%) AngularJS
7 78 (15.98%) REST
8 77 (15.78%) Vue
9 73 (14.96%) ASP.NET
10 71 (14.55%) ASP.NET Core
10 71 (14.55%) Backbone.js
10 71 (14.55%) Ember.js
10 71 (14.55%) Twitter Bootstrap
11 24 (4.92%) Yocto
12 19 (3.89%) Laravel
13 18 (3.69%) Node.js
14 17 (3.48%) HTML5
15 15 (3.07%) MFC
16 11 (2.25%) Middleware
Miscellaneous
1 80 (16.39%) Algorithms
2 77 (15.78%) Data Structures
3 72 (14.75%) Hybrid Cloud
4 71 (14.55%) Blockchain
4 71 (14.55%) e-Learning
5 27 (5.53%) IoT
6 24 (4.92%) Data Centre
7 21 (4.30%) Embedded Systems
7 21 (4.30%) Public Cloud
8 19 (3.89%) Management Information System
9 12 (2.46%) Driving Licence
9 12 (2.46%) Self-Motivation
10 10 (2.05%) Cloud Native
10 10 (2.05%) Linux Command Line
10 10 (2.05%) Replication
11 9 (1.84%) CUDA
11 9 (1.84%) PKI
12 8 (1.64%) Security Operations Centre
13 7 (1.43%) Clustering
14 6 (1.23%) Renewable Energy
Operating Systems
1 243 (49.80%) Windows
2 72 (14.75%) Android
3 71 (14.55%) Apple iOS
4 67 (13.73%) Windows Server
5 58 (11.89%) Unix
6 36 (7.38%) Embedded Linux
7 32 (6.56%) CentOS
8 29 (5.94%) Ubuntu
9 23 (4.71%) SUSE
10 20 (4.10%) Debian
11 18 (3.69%) Red Hat Enterprise Linux
12 13 (2.66%) Solaris
12 13 (2.66%) Windows 10
13 10 (2.05%) Mac OS
14 6 (1.23%) AIX
14 6 (1.23%) SUSE Linux Enterprise Server
15 5 (1.02%) Data ONTAP
15 5 (1.02%) Windows Server 2019
16 2 (0.41%) Oracle Linux
16 2 (0.41%) Windows Server 2003
Processes & Methodologies
1 168 (34.43%) Agile
2 99 (20.29%) Software Engineering
3 93 (19.06%) Full Stack Development
4 92 (18.85%) Problem-Solving
5 90 (18.44%) Mentoring
5 90 (18.44%) User Experience
6 87 (17.83%) Artificial Intelligence
6 87 (17.83%) Web Development
7 84 (17.21%) OO
8 82 (16.80%) OOP
9 79 (16.19%) Coaching
10 78 (15.98%) MVC
11 75 (15.37%) SOLID
12 74 (15.16%) Code Quality
13 73 (14.96%) Design Patterns
14 71 (14.55%) Co-Creation
14 71 (14.55%) Design Thinking
14 71 (14.55%) MVVM
14 71 (14.55%) Responsive Web Design
15 61 (12.50%) DevOps
Programming Languages
1 163 (33.40%) SQL
2 115 (23.57%) C#
3 113 (23.16%) JavaScript
4 83 (17.01%) C
4 83 (17.01%) C++
5 70 (14.34%) Python
6 44 (9.02%) PowerShell
7 36 (7.38%) Java
8 32 (6.56%) Bash
9 23 (4.71%) TypeScript
10 21 (4.30%) PHP
11 17 (3.48%) VB
12 16 (3.28%) Shell Script
13 15 (3.07%) Assembly Language
13 15 (3.07%) Embedded C
14 7 (1.43%) T-SQL
15 6 (1.23%) Embedded C++
15 6 (1.23%) Ruby
16 5 (1.02%) Go
17 3 (0.61%) sed
Qualifications
1 79 (16.19%) Degree
2 39 (7.99%) Security Cleared
3 22 (4.51%) Cisco Certification
4 21 (4.30%) Azure Certification
4 21 (4.30%) CCNA
5 19 (3.89%) SC Cleared
6 18 (3.69%) Computer Science Degree
6 18 (3.69%) Microsoft Certification
7 14 (2.87%) DV Cleared
8 12 (2.46%) AWS Certification
8 12 (2.46%) OCP
8 12 (2.46%) Oracle Certification
9 11 (2.25%) CCNP
10 10 (2.05%) AWS Certified Solutions Architect
11 9 (1.84%) HNC
11 9 (1.84%) MCSE
12 7 (1.43%) Network+ Certification
13 6 (1.23%) DBS Check
14 5 (1.02%) Master's Degree
14 5 (1.02%) PhD
Quality Assurance & Compliance
1 19 (3.89%) QA
2 11 (2.25%) ISO/IEC 27001
3 10 (2.05%) GDPR
4 8 (1.64%) NIST
5 7 (1.43%) Accessibility
6 6 (1.23%) Data Quality
7 5 (1.02%) MISRA
8 3 (0.61%) JSP 440
9 2 (0.41%) AUTOSAR
9 2 (0.41%) ISO 26262
System Software
1 76 (15.57%) Active Directory
2 44 (9.02%) VMware Infrastructure
3 38 (7.79%) Hyper-V
4 35 (7.17%) Docker
5 29 (5.94%) Firmware
6 14 (2.87%) Virtual Machines
7 13 (2.66%) Embedded Firmware
7 13 (2.66%) vSphere
8 7 (1.43%) VMware Server
8 7 (1.43%) VMware Workstation
9 6 (1.23%) Oracle RAC
9 6 (1.23%) VMware ESXi
10 5 (1.02%) VMware NSX
11 4 (0.82%) Virtual Servers
12 2 (0.41%) Citrix Hypervisor
12 2 (0.41%) pfSense
12 2 (0.41%) Terminal Services
Systems Management
1 31 (6.35%) Kubernetes
2 23 (4.71%) Ansible
3 13 (2.66%) Docker Swarm
3 13 (2.66%) Terraform
4 10 (2.05%) vCenter Server
5 8 (1.64%) SCOM
6 6 (1.23%) Data Guard
6 6 (1.23%) Oracle RMAN
6 6 (1.23%) Prometheus
6 6 (1.23%) Tivoli Storage Manager
7 5 (1.02%) Backup Exec
7 5 (1.02%) WSUS
8 3 (0.61%) FortiGate
8 3 (0.61%) Functional Safety
8 3 (0.61%) Microsoft Intune
8 3 (0.61%) SCOrch
8 3 (0.61%) vMotion
9 2 (0.41%) Nagios
9 2 (0.41%) SCCM
9 2 (0.41%) Trend Micro Deep Security
Vendors
1 98 (20.08%) Microsoft
2 87 (17.83%) Red Hat
3 84 (17.21%) IBM
4 69 (14.14%) VMware
5 39 (7.99%) Cisco
6 35 (7.17%) Oracle
7 19 (3.89%) Veeam
8 18 (3.69%) Citrix
9 14 (2.87%) Remedy
10 10 (2.05%) Google
11 9 (1.84%) NVIDIA
12 7 (1.43%) Dell
12 7 (1.43%) NEC
12 7 (1.43%) Ubiquiti
13 6 (1.23%) Databricks
13 6 (1.23%) ESET
13 6 (1.23%) QNX
14 5 (1.02%) NetApp
14 5 (1.02%) Palo Alto
14 5 (1.02%) SolidFire