MySQL Jobs in the North of England

MySQL
England > North of England

The following table provides summary statistics for permanent job vacancies advertised in the North of England with a requirement for MySQL skills. Included is a benchmarking guide to the salaries offered in vacancies that have cited MySQL over the 6 months to 11 May 2024 with a comparison to the same period in the previous 2 years.

6 months to
11 May 2024
Same period 2023 Same period 2022
Rank 95 163 68
Rank change year-on-year +68 -95 -24
Permanent jobs citing MySQL 448 359 775
As % of all permanent jobs advertised in the North of England 2.56% 2.09% 4.31%
As % of the Database & Business Intelligence category 14.49% 10.19% 20.13%
Number of salaries quoted 392 176 463
10th Percentile £33,750 £31,250 £32,500
25th Percentile £41,250 £40,000 £34,500
Median annual salary (50th Percentile) £52,500 £47,500 £52,500
Median % change year-on-year +10.53% -9.52% +22.09%
75th Percentile £68,750 £60,000 £60,000
90th Percentile £73,250 £72,500 £67,500
England median annual salary £53,500 £57,500 £55,000
% change year-on-year -6.96% +4.55% +10.00%

All Database and Business Intelligence Skills
North of England

MySQL is in the Databases and Business Intelligence category. The following table is for comparison with the above and provides summary statistics for all permanent job vacancies advertised in the North of England with a requirement for database or business intelligence skills.

Permanent vacancies with a requirement for database or business intelligence skills 3,092 3,524 3,850
As % of all permanent jobs advertised in the North of England 17.66% 20.49% 21.41%
Number of salaries quoted 2,306 1,804 2,525
10th Percentile £31,579 £34,723 £32,500
25th Percentile £40,000 £40,500 £39,000
Median annual salary (50th Percentile) £50,000 £54,191 £50,000
Median % change year-on-year -7.73% +8.38% +5.26%
75th Percentile £65,603 £70,000 £65,000
90th Percentile £82,500 £80,000 £77,500
England median annual salary £57,500 £65,000 £60,000
% change year-on-year -11.54% +8.33% +9.09%

MySQL
Job Vacancy Trend in the North of England

Job postings citing MySQL as a proportion of all IT jobs advertised in the North of England.
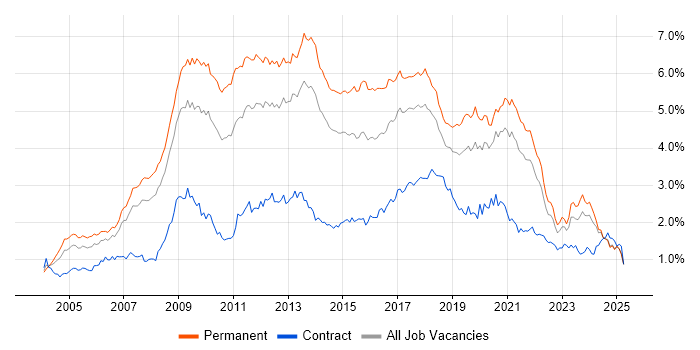
Job vacancy trend for MySQL in the North of England

MySQL
Salary Trend in the North of England

3-month moving average salary quoted in jobs citing MySQL in the North of England.

Salary trend for MySQL in the North of England

MySQL
Salary Histogram in the North of England

Salary distribution for jobs citing MySQL in the North of England over the 6 months to 11 May 2024.

Salary histogram for MySQL in the North of England

MySQL
Job Locations in the North of England

The table below looks at the demand and provides a guide to the median salaries quoted in IT jobs citing MySQL within the North of England region over the 6 months to 11 May 2024. The 'Rank Change' column provides an indication of the change in demand within each location based on the same 6 month period last year.

Location Rank Change
on Same Period
Last Year
Matching
Permanent
IT Job Ads
Median Salary
Past 6 Months
Median Salary
% Change
on Same Period
Last Year
Live
Jobs
North West +50 234 £55,000 +5.77% 48
Yorkshire +67 145 £47,500 +5.56% 22
North East +19 71 £62,500 +56.25% 11
MySQL
England

MySQL
Co-occurring Skills and Capabilities in the North of England by Category

The follow tables expand on the table above by listing co-occurrences grouped by category. The same employment type, locality and period is covered with up to 20 co-occurrences shown in each of the following categories:

Application Platforms
1 15 (3.35%) WordPress
2 13 (2.90%) ArcGIS
3 9 (2.01%) nginx
4 6 (1.34%) Apache
5 5 (1.12%) CMS
6 4 (0.89%) Confluence
6 4 (0.89%) Drupal
6 4 (0.89%) SharePoint
7 2 (0.45%) Apache Solr
7 2 (0.45%) Oracle SOA Suite
Applications
1 4 (0.89%) Adobe XD
2 2 (0.45%) Sketch
3 1 (0.22%) Microsoft Project
3 1 (0.22%) MS Visio
Business Applications
1 11 (2.46%) Magento
2 7 (1.56%) Shopify
3 6 (1.34%) Payment Gateway
4 1 (0.22%) Dynamics CRM
Cloud Services
1 186 (41.52%) AWS
2 81 (18.08%) Azure
3 56 (12.50%) Serverless
4 45 (10.04%) AWS Lambda
5 41 (9.15%) GitHub
6 38 (8.48%) SaaS
7 37 (8.26%) Amazon S3
8 28 (6.25%) Amazon Kinesis
9 23 (5.13%) Azure DevOps
10 22 (4.91%) Amazon EC2
11 18 (4.02%) GCP
12 13 (2.90%) Amazon ECS
13 10 (2.23%) GitHub Actions
14 9 (2.01%) AWS CloudFormation
14 9 (2.01%) OCI
15 8 (1.79%) AWS Elastic Beanstalk
15 8 (1.79%) Azure Cosmos DB
16 7 (1.56%) Azure AKS
16 7 (1.56%) Azure Monitor
16 7 (1.56%) Stripe
Communications & Networking
1 5 (1.12%) DHCP
1 5 (1.12%) DNS
2 3 (0.67%) Wireless
3 2 (0.45%) FTP
3 2 (0.45%) HTTP
3 2 (0.45%) Internet
3 2 (0.45%) WAN
4 1 (0.22%) Asterisk PBX
4 1 (0.22%) Firewall
4 1 (0.22%) IMAP
4 1 (0.22%) LAN
4 1 (0.22%) SD-WAN
4 1 (0.22%) SMTP
4 1 (0.22%) VoIP
4 1 (0.22%) VPN
4 1 (0.22%) VSAN
Database & Business Intelligence
1 114 (25.45%) PostgreSQL
2 82 (18.30%) SQL Server
3 68 (15.18%) MongoDB
4 65 (14.51%) Relational Database
5 61 (13.62%) NoSQL
6 37 (8.26%) DynamoDB
7 36 (8.04%) Redis
8 35 (7.81%) Amazon RDS
9 33 (7.37%) Data Warehouse
10 28 (6.25%) RDBMS
11 17 (3.79%) Amazon Redshift
12 13 (2.90%) GIS
13 12 (2.68%) Azure SQL Database
14 11 (2.46%) Geospatial Data
15 10 (2.23%) Oracle Database
16 8 (1.79%) Couchbase
16 8 (1.79%) MariaDB
17 7 (1.56%) Elasticsearch
18 5 (1.12%) InfluxDB
18 5 (1.12%) Neo4j
Development Applications
1 100 (22.32%) Git
2 25 (5.58%) Bitbucket
3 23 (5.13%) PHPUnit
4 20 (4.46%) GitLab
5 19 (4.24%) Jenkins
6 18 (4.02%) Postman
7 17 (3.79%) JIRA
8 11 (2.46%) TeamCity
9 8 (1.79%) Team Foundation Server
10 6 (1.34%) Subversion
11 5 (1.12%) GDB
12 2 (0.45%) Cypress.io
12 2 (0.45%) gulp
12 2 (0.45%) webpack
13 1 (0.22%) Appium
13 1 (0.22%) Cucumber
13 1 (0.22%) Mercurial
13 1 (0.22%) Mockito
13 1 (0.22%) RSpec
13 1 (0.22%) Visual Studio Team System
General
1 70 (15.63%) Social Skills
2 42 (9.38%) Analytical Skills
3 36 (8.04%) Retail
4 33 (7.37%) Games
5 21 (4.69%) Public Sector
6 19 (4.24%) Manufacturing
7 14 (3.13%) Marketing
8 13 (2.90%) Finance
9 12 (2.68%) Legal
10 11 (2.46%) Health Technology
11 9 (2.01%) Organisational Skills
12 7 (1.56%) Telecoms
13 6 (1.34%) Banking
13 6 (1.34%) Tech for Good
14 5 (1.12%) Law
15 4 (0.89%) Pharmaceutical
16 3 (0.67%) Agriculture
17 2 (0.45%) Aviation
17 2 (0.45%) Inclusion and Diversity
17 2 (0.45%) Mandarin Language
Job Titles
1 265 (59.15%) Developer
2 126 (28.13%) Senior
3 101 (22.54%) PHP Developer
4 79 (17.63%) Software Engineer
5 68 (15.18%) Senior Developer
6 55 (12.28%) Lead
7 48 (10.71%) Full Stack Developer
8 44 (9.82%) Senior Software Engineer
9 43 (9.60%) Software Developer
10 29 (6.47%) Technical Leader
11 27 (6.03%) .NET Developer
12 24 (5.36%) Java Engineer
12 24 (5.36%) Lead Developer
13 22 (4.91%) Java Software Engineer
13 22 (4.91%) Senior Java Engineer
13 22 (4.91%) Senior PHP Developer
14 20 (4.46%) C# Developer
14 20 (4.46%) Senior Java Software Engineer
15 18 (4.02%) DBA
16 16 (3.57%) Senior Full Stack Developer
Libraries, Frameworks & Software Standards
1 125 (27.90%) Laravel
2 123 (27.46%) CSS
3 108 (24.11%) HTML
4 105 (23.44%) Vue
5 103 (22.99%) React
6 94 (20.98%) .NET
7 86 (19.20%) RESTful
8 83 (18.53%) Node.js
9 61 (13.62%) AngularJS
10 40 (8.93%) ASP.NET
10 40 (8.93%) JSON
11 35 (7.81%) jQuery
12 29 (6.47%) Symfony
13 27 (6.03%) HTML5
14 25 (5.58%) .NET Core
14 25 (5.58%) Spring
14 25 (5.58%) Twitter Bootstrap
14 25 (5.58%) XML
15 24 (5.36%) Spring Boot
16 20 (4.46%) Tailwind CSS
Miscellaneous
1 31 (6.92%) Greenfield Project
2 21 (4.69%) Client/Server
3 20 (4.46%) Cloud Native
4 17 (3.79%) Management Information System
5 14 (3.13%) Data Structures
6 13 (2.90%) Online Games
7 12 (2.68%) Data Centre
7 12 (2.68%) Mainframe
7 12 (2.68%) SCADA
8 10 (2.23%) IoT
9 9 (2.01%) Product Ownership
10 7 (1.56%) Private Cloud
10 7 (1.56%) Self-Motivation
10 7 (1.56%) Video\Live Streaming
11 5 (1.12%) Linux Command Line
12 4 (0.89%) Enterprise Cloud
12 4 (0.89%) Fat Client
12 4 (0.89%) NHS
12 4 (0.89%) Onboarding
12 4 (0.89%) Thin Client
Operating Systems
1 70 (15.63%) Linux
2 29 (6.47%) Windows
3 19 (4.24%) Unix
4 12 (2.68%) Apple iOS
5 11 (2.46%) Ubuntu
6 10 (2.23%) Android
7 9 (2.01%) Windows Server
8 2 (0.45%) AIX
8 2 (0.45%) CentOS
9 1 (0.22%) Debian
9 1 (0.22%) Red Hat Enterprise Linux
9 1 (0.22%) Windows Server 2012
9 1 (0.22%) Windows Server 2019
Processes & Methodologies
1 144 (32.14%) Agile
2 127 (28.35%) Software Engineering
3 122 (27.23%) Problem-Solving
4 107 (23.88%) Full Stack Development
5 74 (16.52%) Design Patterns
6 70 (15.63%) Mentoring
7 64 (14.29%) DevOps
8 62 (13.84%) Computer Science
9 57 (12.72%) CI/CD
10 55 (12.28%) MVC
11 54 (12.05%) Web Development
12 51 (11.38%) Microservices
13 46 (10.27%) SDLC
14 41 (9.15%) OOP
14 41 (9.15%) TDD
15 40 (8.93%) E-Commerce
16 39 (8.71%) Roadmaps
17 37 (8.26%) Clean Code
17 37 (8.26%) OO
18 36 (8.04%) Coaching
Programming Languages
1 197 (43.97%) PHP
2 164 (36.61%) JavaScript
3 155 (34.60%) SQL
4 120 (26.79%) C#
5 81 (18.08%) Java
6 59 (13.17%) Python
7 49 (10.94%) TypeScript
8 21 (4.69%) PowerShell
8 21 (4.69%) Ruby
9 13 (2.90%) T-SQL
10 11 (2.46%) VB.NET
11 10 (2.23%) Bash
11 10 (2.23%) Go
11 10 (2.23%) Perl
12 9 (2.01%) PL/SQL
12 9 (2.01%) Swift
13 5 (1.12%) Groovy
14 4 (0.89%) XAML
15 3 (0.67%) VB
16 1 (0.22%) RPG
Qualifications
1 76 (16.96%) Degree
2 49 (10.94%) Computer Science Degree
3 15 (3.35%) AWS Certification
4 12 (2.68%) Azure Certification
5 8 (1.79%) OCP
5 8 (1.79%) Oracle Certification
6 4 (0.89%) SC Cleared
6 4 (0.89%) Security Cleared
7 2 (0.45%) Numerate Degree
8 1 (0.22%) BPSS Clearance
8 1 (0.22%) ISTQB
8 1 (0.22%) ITIL Foundation Certificate
8 1 (0.22%) Master's Degree
Quality Assurance & Compliance
1 13 (2.90%) QA
2 5 (1.12%) Accessibility
3 3 (0.67%) GDPR
4 1 (0.22%) SLA
System Software
1 73 (16.29%) Docker
2 7 (1.56%) Active Directory
3 4 (0.89%) VMware ESXi
4 1 (0.22%) Dovecot
4 1 (0.22%) Hyper-V
4 1 (0.22%) Postfix
Systems Management
1 55 (12.28%) Terraform
2 38 (8.48%) Kubernetes
3 11 (2.46%) Ansible
4 9 (2.01%) Grafana
5 8 (1.79%) Prometheus
6 7 (1.56%) Puppet
7 5 (1.12%) Progress Chef
8 4 (0.89%) Rancher
9 2 (0.45%) Kibana
9 2 (0.45%) logstash
10 1 (0.22%) Foglight
10 1 (0.22%) Oracle Identity Management
Vendors
1 53 (11.83%) Oracle
2 29 (6.47%) Microsoft
3 13 (2.90%) Facebook
4 9 (2.01%) VMware
5 7 (1.56%) ESRI
5 7 (1.56%) Google
6 6 (1.34%) Actuate
7 5 (1.12%) New Relic
7 5 (1.12%) PayPal
7 5 (1.12%) SaltStack
7 5 (1.12%) WorldPay
8 4 (0.89%) Adobe
8 4 (0.89%) HP
9 3 (0.67%) Databricks
9 3 (0.67%) WooCommerce
10 2 (0.45%) Cisco
10 2 (0.45%) Informatica
10 2 (0.45%) Progress
10 2 (0.45%) SAP
10 2 (0.45%) Zend