MySQL Jobs in England

MySQL
UK > England

The table below provides summary statistics for permanent job vacancies advertised in England requiring MySQL skills. It includes a benchmarking guide to the annual salaries offered in vacancies that cited MySQL over the 6 months leading up to 26 July 2024, comparing them to the same period in the previous two years.

6 months to
26 Jul 2024
Same period 2023 Same period 2022
Rank 178 170 97
Rank change year-on-year -8 -73 -23
Permanent jobs citing MySQL 1,206 1,504 5,235
As % of all permanent jobs advertised in England 1.54% 2.12% 3.56%
As % of the Database & Business Intelligence category 9.65% 10.08% 13.09%
Number of salaries quoted 990 1,018 2,234
10th Percentile £32,500 £33,750 £32,500
25th Percentile £41,250 £42,500 £40,399
Median annual salary (50th Percentile) £52,500 £55,000 £55,000
Median % change year-on-year -4.55% - +10.00%
75th Percentile £66,250 £72,500 £72,500
90th Percentile £77,500 £90,000 £90,000
UK median annual salary £52,500 £56,000 £55,000
% change year-on-year -6.25% +1.82% +10.00%

All Database and Business Intelligence Skills
England

MySQL falls under the Databases and Business Intelligence category. For comparison with the information above, the following table provides summary statistics for all permanent job vacancies requiring database or business intelligence skills in England.

Permanent vacancies with a requirement for database or business intelligence skills 12,495 14,926 39,989
As % of all permanent jobs advertised in England 15.95% 21.00% 27.20%
Number of salaries quoted 8,650 10,674 19,065
10th Percentile £36,250 £37,500 £36,250
25th Percentile £45,000 £47,500 £45,491
Median annual salary (50th Percentile) £60,000 £65,000 £60,000
Median % change year-on-year -7.69% +8.33% +9.09%
75th Percentile £84,188 £82,500 £81,250
90th Percentile £112,500 £100,000 £97,500
UK median annual salary £60,000 £62,500 £60,000
% change year-on-year -4.00% +4.17% +9.09%

MySQL
Job Vacancy Trend in England

Job postings citing MySQL as a proportion of all IT jobs advertised in England.
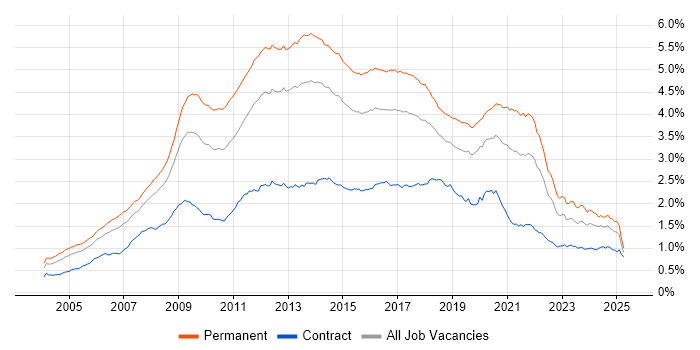
Job vacancy trend for MySQL in England

MySQL
Salary Trend in England

3-month moving average salary quoted in jobs citing MySQL in England.

Salary trend for MySQL in England

MySQL
Salary Histogram in England

Salary distribution for jobs citing MySQL in England over the 6 months to 26 July 2024.

Salary histogram for MySQL in England

MySQL
Job Locations in England

The table below looks at the demand and provides a guide to the median salaries quoted in IT jobs citing MySQL within the England region over the 6 months to 26 July 2024. The 'Rank Change' column provides an indication of the change in demand within each location based on the same 6 month period last year.

Location Rank Change
on Same Period
Last Year
Matching
Permanent
IT Job Ads
Median Salary
Past 6 Months
Median Salary
% Change
on Same Period
Last Year
Live
Jobs
North of England +17 326 £52,500 +0.96% 45
London -17 224 £66,000 -10.51% 30
South East -61 216 £52,500 +5.00% 37
Midlands -32 180 £50,000 -9.09% 21
North West +12 179 £55,000 - 24
South West -3 146 £50,000 - 16
Yorkshire +36 117 £51,500 +3.00% 11
West Midlands -16 108 £55,000 - 17
East of England -2 102 £47,500 -17.39% 16
East Midlands -34 67 £42,500 -19.05% 4
North East -13 30 £65,000 +62.50% 10
MySQL
UK

MySQL
Co-occurring Skills and Capabilities in England by Category

The follow tables expand on the table above by listing co-occurrences grouped by category. The same employment type, locality and period is covered with up to 20 co-occurrences shown in each of the following categories:

Application Platforms
1 64 (5.31%) WordPress
2 43 (3.57%) Apache
2 43 (3.57%) CMS
3 37 (3.07%) nginx
4 22 (1.82%) SharePoint
5 20 (1.66%) Confluence
6 19 (1.58%) Drupal
7 15 (1.24%) Microsoft Exchange
8 13 (1.08%) Moodle
9 11 (0.91%) Apache Spark
10 10 (0.83%) Totara
11 8 (0.66%) ArcGIS
11 8 (0.66%) IIS
11 8 (0.66%) Tomcat
12 5 (0.41%) Apache Airflow
12 5 (0.41%) Apache Solr
12 5 (0.41%) OpenStack
13 4 (0.33%) Headless CMS
13 4 (0.33%) MQSeries
13 4 (0.33%) WebSphere
Applications
1 16 (1.33%) Microsoft Excel
2 5 (0.41%) Microsoft Office
3 4 (0.33%) SPSS
4 2 (0.17%) FileZilla
4 2 (0.17%) Microsoft PowerPoint
5 1 (0.083%) Adobe XD
5 1 (0.083%) Microsoft Project
5 1 (0.083%) MS Visio
5 1 (0.083%) Notion
Business Applications
1 25 (2.07%) Magento
2 12 (1.00%) Payment Gateway
3 11 (0.91%) Shopify
4 5 (0.41%) NetSuite
4 5 (0.41%) Salesforce CRM
5 4 (0.33%) Maximo
6 3 (0.25%) iTrent
7 2 (0.17%) Relativity
7 2 (0.17%) Veritas eDiscovery
7 2 (0.17%) Visualfiles
8 1 (0.083%) Elite 3E
8 1 (0.083%) R3 Corda
8 1 (0.083%) Remedy ITSM
8 1 (0.083%) Ripple
8 1 (0.083%) Ripple XRP
8 1 (0.083%) SAP ERP
8 1 (0.083%) Sparx Enterprise Architect
Cloud Services
1 455 (37.73%) AWS
2 198 (16.42%) Azure
3 93 (7.71%) SaaS
4 89 (7.38%) GitHub
5 83 (6.88%) GCP
6 64 (5.31%) Serverless
7 49 (4.06%) Amazon S3
8 47 (3.90%) Microsoft 365
9 46 (3.81%) AWS Lambda
10 42 (3.48%) Amazon Kinesis
11 38 (3.15%) Amazon EC2
12 29 (2.40%) GitHub Actions
12 29 (2.40%) Power Platform
13 27 (2.24%) Azure DevOps
14 17 (1.41%) PaaS
15 16 (1.33%) Amazon CloudWatch
15 16 (1.33%) Entra ID
16 15 (1.24%) Datadog
17 14 (1.16%) Amazon ECS
18 13 (1.08%) Snowflake
Communications & Networking
1 23 (1.91%) HTTP
2 22 (1.82%) LAN
2 22 (1.82%) WAN
3 18 (1.49%) Firewall
4 14 (1.16%) DNS
5 13 (1.08%) VPN
5 13 (1.08%) Wi-Fi
6 10 (0.83%) MQTT
7 9 (0.75%) Internet
7 9 (0.75%) TCP/IP
8 8 (0.66%) SAN
9 6 (0.50%) DAB
9 6 (0.50%) FTP
9 6 (0.50%) Reverse Proxy
9 6 (0.50%) SSH
10 5 (0.41%) SD-WAN
10 5 (0.41%) WLAN
11 4 (0.33%) Ethernet
11 4 (0.33%) NetScaler
11 4 (0.33%) SMTP
Database & Business Intelligence
1 214 (17.74%) PostgreSQL
1 214 (17.74%) SQL Server
2 166 (13.76%) Relational Database
3 139 (11.53%) MongoDB
4 104 (8.62%) NoSQL
5 67 (5.56%) Amazon RDS
5 67 (5.56%) Redis
6 55 (4.56%) MariaDB
6 55 (4.56%) RDBMS
7 49 (4.06%) Data Warehouse
8 48 (3.98%) DynamoDB
9 39 (3.23%) Elasticsearch
10 34 (2.82%) Amazon Redshift
11 28 (2.32%) Power BI
12 27 (2.24%) Amazon Aurora
13 12 (1.00%) BigQuery
13 12 (1.00%) SQLite
14 11 (0.91%) Tableau
15 10 (0.83%) GIS
15 10 (0.83%) InfluxDB
Development Applications
1 322 (26.70%) Git
2 77 (6.38%) JIRA
3 41 (3.40%) Jenkins
4 39 (3.23%) Bitbucket
5 26 (2.16%) PHPUnit
5 26 (2.16%) Postman
6 22 (1.82%) GitLab
7 18 (1.49%) Visual Studio
8 15 (1.24%) Subversion
9 14 (1.16%) Selenium
10 8 (0.66%) Cucumber
10 8 (0.66%) SonarQube
11 7 (0.58%) Gradle
11 7 (0.58%) webpack
12 6 (0.50%) Gatling
12 6 (0.50%) gulp
12 6 (0.50%) Maven
13 5 (0.41%) Eclipse
13 5 (0.41%) GDB
13 5 (0.41%) JUnit
General
1 239 (19.82%) Social Skills
2 105 (8.71%) Analytical Skills
3 72 (5.97%) Finance
4 55 (4.56%) Retail
5 47 (3.90%) Marketing
6 45 (3.73%) Public Sector
7 40 (3.32%) Tech for Good
8 35 (2.90%) Games
9 33 (2.74%) Manufacturing
10 31 (2.57%) Law
11 22 (1.82%) Inclusion and Diversity
12 18 (1.49%) Legal
12 18 (1.49%) Organisational Skills
13 17 (1.41%) Banking
14 16 (1.33%) Automotive
15 14 (1.16%) Telecoms
16 13 (1.08%) Health Technology
17 12 (1.00%) Pharmaceutical
18 9 (0.75%) Social Housing
19 8 (0.66%) Front Office
Job Titles
1 695 (57.63%) Developer
2 307 (25.46%) PHP Developer
3 284 (23.55%) Senior
4 171 (14.18%) Senior Developer
5 153 (12.69%) Software Engineer
6 125 (10.36%) Full Stack Developer
7 97 (8.04%) Lead
8 74 (6.14%) Senior PHP Developer
8 74 (6.14%) Web Developer
9 68 (5.64%) Software Developer
10 60 (4.98%) Senior Software Engineer
11 51 (4.23%) DBA
12 43 (3.57%) Java Engineer
12 43 (3.57%) Java Software Engineer
13 38 (3.15%) Technical Leader
14 37 (3.07%) Lead Developer
15 36 (2.99%) PHP Web Developer
16 35 (2.90%) Analyst
17 32 (2.65%) .NET Developer
17 32 (2.65%) Senior Java Software Engineer
Libraries, Frameworks & Software Standards
1 401 (33.25%) HTML
2 386 (32.01%) CSS
3 317 (26.29%) Laravel
4 233 (19.32%) React
5 161 (13.35%) .NET
6 159 (13.18%) RESTful
7 127 (10.53%) Node.js
7 127 (10.53%) Vue
8 118 (9.78%) jQuery
9 108 (8.96%) Symfony
10 102 (8.46%) AngularJS
11 101 (8.37%) Web Services
12 95 (7.88%) LAMP
13 90 (7.46%) HTML5
14 87 (7.21%) REST
15 56 (4.64%) CSS3
16 54 (4.48%) Spring
16 54 (4.48%) XML
17 53 (4.39%) JSON
18 52 (4.31%) Spring Boot
Miscellaneous
1 48 (3.98%) Greenfield Project
2 45 (3.73%) Cloud Native
3 43 (3.57%) IoT
3 43 (3.57%) Management Information System
4 33 (2.74%) Mobile App
5 26 (2.16%) Algorithms
6 23 (1.91%) Legacy Systems
7 22 (1.82%) Data Centre
8 21 (1.74%) Onboarding
9 19 (1.58%) Enterprise Software
9 19 (1.58%) Replication
10 16 (1.33%) Product Ownership
11 15 (1.24%) Data Structures
11 15 (1.24%) Mainframe
12 13 (1.08%) Client/Server
12 13 (1.08%) Self-Motivation
13 12 (1.00%) e-Learning
14 11 (0.91%) NHS
14 11 (0.91%) SCADA
14 11 (0.91%) Virtual Team
Operating Systems
1 261 (21.64%) Linux
2 102 (8.46%) Windows
3 41 (3.40%) Windows Server
4 36 (2.99%) Unix
5 24 (1.99%) Ubuntu
6 22 (1.82%) Android
7 21 (1.74%) Apple iOS
7 21 (1.74%) Windows Server 2019
8 15 (1.24%) Windows Server 2016
9 14 (1.16%) Windows 10
10 13 (1.08%) CentOS
11 12 (1.00%) Red Hat Enterprise Linux
12 7 (0.58%) Debian
13 6 (0.50%) Rocky
13 6 (0.50%) Windows Server 2012
14 4 (0.33%) Amazon Linux
14 4 (0.33%) Windows 7
14 4 (0.33%) Windows Server 2008
15 3 (0.25%) VMS
16 2 (0.17%) AIX
Processes & Methodologies
1 328 (27.20%) Agile
2 295 (24.46%) Software Engineering
3 281 (23.30%) Problem-Solving
4 242 (20.07%) Full Stack Development
5 183 (15.17%) Web Development
6 161 (13.35%) DevOps
7 152 (12.60%) MVC
8 150 (12.44%) OOP
9 141 (11.69%) CI/CD
10 140 (11.61%) OO
11 131 (10.86%) Computer Science
12 128 (10.61%) Microservices
13 127 (10.53%) E-Commerce
14 117 (9.70%) Mentoring
15 105 (8.71%) TDD
16 104 (8.62%) User Experience
17 94 (7.79%) Clean Code
18 81 (6.72%) Design Patterns
19 75 (6.22%) Infrastructure as Code
20 72 (5.97%) Roadmaps
Programming Languages
1 569 (47.18%) PHP
2 509 (42.21%) JavaScript
3 347 (28.77%) SQL
4 191 (15.84%) Python
5 177 (14.68%) Java
6 163 (13.52%) C#
7 89 (7.38%) TypeScript
8 44 (3.65%) PowerShell
9 39 (3.23%) Bash
10 28 (2.32%) Perl
11 27 (2.24%) Ruby
12 26 (2.16%) Go
13 23 (1.91%) C++
14 16 (1.33%) PL/SQL
15 15 (1.24%) Scala
16 12 (1.00%) C
17 11 (0.91%) T-SQL
18 10 (0.83%) Swift
19 9 (0.75%) R
19 9 (0.75%) VB.NET
Qualifications
1 180 (14.93%) Degree
2 93 (7.71%) Computer Science Degree
3 33 (2.74%) Security Cleared
4 26 (2.16%) SC Cleared
5 24 (1.99%) Master's Degree
6 9 (0.75%) AWS Certification
7 8 (0.66%) Microsoft Certification
8 6 (0.50%) DV Cleared
8 6 (0.50%) ITIL Certification
9 5 (0.41%) DBS Check
9 5 (0.41%) MCSE
10 4 (0.33%) PMI Certification
11 3 (0.25%) CCNA
11 3 (0.25%) Cisco Certification
11 3 (0.25%) CompTIA Security+
11 3 (0.25%) Network+ Certification
11 3 (0.25%) Numerate Degree
11 3 (0.25%) Postgraduate
11 3 (0.25%) VMware Certified Professional (VCP)
12 2 (0.17%) Azure Certification
Quality Assurance & Compliance
1 34 (2.82%) QA
2 19 (1.58%) GDPR
3 16 (1.33%) Accessibility
4 7 (0.58%) Data Quality
4 7 (0.58%) HIPAA
4 7 (0.58%) ISO/IEC 27001
4 7 (0.58%) SLA
5 2 (0.17%) SOC 2
6 1 (0.083%) ISO/IEC 15288
6 1 (0.083%) NCSC
6 1 (0.083%) NIST
6 1 (0.083%) PCI DSS
6 1 (0.083%) Software Quality Assurance
System Software
1 155 (12.85%) Docker
2 45 (3.73%) Active Directory
3 30 (2.49%) VMware Infrastructure
4 15 (1.24%) Hyper-V
5 11 (0.91%) VMware ESXi
6 8 (0.66%) vSphere
7 5 (0.41%) Citrix Hypervisor
7 5 (0.41%) Firmware
7 5 (0.41%) NFS
8 4 (0.33%) pfSense
8 4 (0.33%) Virtual Desktop
8 4 (0.33%) XenApp
9 3 (0.25%) Virtual Machines
10 2 (0.17%) Varnish
11 1 (0.083%) Dovecot
11 1 (0.083%) GlusterFS
11 1 (0.083%) Postfix
11 1 (0.083%) VMware Server
11 1 (0.083%) VMware Workstation
Systems Management
1 117 (9.70%) Terraform
2 83 (6.88%) Kubernetes
3 30 (2.49%) Ansible
4 11 (0.91%) Nagios
5 10 (0.83%) SCCM
6 8 (0.66%) Puppet
6 8 (0.66%) vCenter Server
7 7 (0.58%) Active Directory Federation Services
8 6 (0.50%) cPanel
8 6 (0.50%) EMC NetWorker
8 6 (0.50%) Grafana
9 5 (0.41%) Foglight
9 5 (0.41%) Plesk
9 5 (0.41%) Red Hat Spacewalk
10 4 (0.33%) EMC VPLEX
10 4 (0.33%) Microsoft Intune
11 3 (0.25%) Oracle Enterprise Manager
12 2 (0.17%) Packer
12 2 (0.17%) WMI
12 2 (0.17%) WSUS
Vendors
1 98 (8.13%) Microsoft
2 85 (7.05%) Oracle
3 57 (4.73%) VMware
4 46 (3.81%) Google
5 15 (1.24%) Cisco
6 14 (1.16%) Twitter
7 13 (1.08%) Atlassian
7 13 (1.08%) EMC
8 12 (1.00%) Databricks
9 11 (0.91%) Veeam
10 10 (0.83%) WooCommerce
11 9 (0.75%) Aruba
11 9 (0.75%) Facebook
11 9 (0.75%) Fortinet
11 9 (0.75%) Salesforce
11 9 (0.75%) SAP
11 9 (0.75%) SolarWinds
11 9 (0.75%) Zend
12 8 (0.66%) Citrix
12 8 (0.66%) Red Hat