Test Automation Jobs in the North of England

Automated Testing
England > North of England

The table below provides summary statistics for permanent job vacancies advertised in the North of England requiring Test Automation skills. It includes a benchmarking guide to the annual salaries offered in vacancies that cited Test Automation over the 6 months leading up to 13 July 2025, comparing them to the same period in the previous two years.

6 months to
13 Jul 2025
Same period 2024 Same period 2023
Rank 132 122 76
Rank change year-on-year -10 -46 -37
Permanent jobs citing Test Automation 299 371 595
As % of all permanent jobs advertised in the North of England 2.26% 1.97% 4.23%
As % of the Processes & Methodologies category 2.59% 2.47% 4.37%
Number of salaries quoted 132 222 268
10th Percentile £32,050 £36,250 £37,500
25th Percentile £47,000 £43,750 £43,063
Median annual salary (50th Percentile) £60,000 £57,500 £57,500
Median % change year-on-year +4.35% - +9.52%
75th Percentile £78,125 £71,991 £71,563
90th Percentile £97,528 £78,250 £83,842
England median annual salary £62,500 £60,000 £65,000
% change year-on-year +4.17% -7.69% +8.33%

All Process and Methodology Skills
North of England

Test Automation falls under the Processes and Methodologies category. For comparison with the information above, the following table provides summary statistics for all permanent job vacancies requiring process or methodology skills in the North of England.

Permanent vacancies with a requirement for process or methodology skills 11,540 15,050 13,606
As % of all permanent jobs advertised in the North of England 87.37% 80.08% 96.67%
Number of salaries quoted 5,782 10,787 7,658
10th Percentile £25,087 £27,750 £30,750
25th Percentile £33,250 £37,500 £40,000
Median annual salary (50th Percentile) £50,000 £50,000 £55,000
Median % change year-on-year - -9.09% +9.45%
75th Percentile £62,500 £65,000 £70,000
90th Percentile £77,500 £80,000 £81,250
England median annual salary £55,000 £55,000 £62,450
% change year-on-year - -11.93% +4.08%

Test Automation
Job Vacancy Trend in the North of England

Job postings citing Test Automation as a proportion of all IT jobs advertised in the North of England.
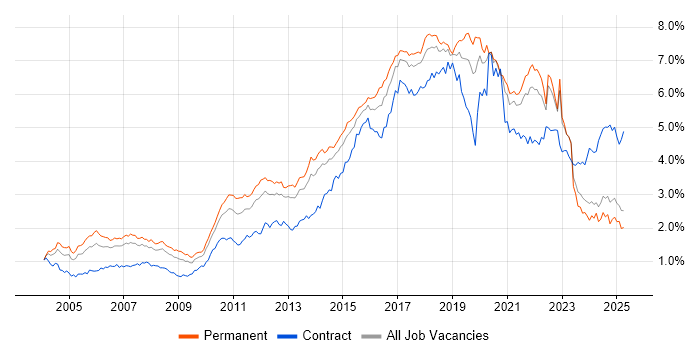
Job vacancy trend for Test Automation in the North of England

Test Automation
Salary Trend in the North of England

3-month moving average salary quoted in jobs citing Test Automation in the North of England.

Salary trend for Test Automation in the North of England

Test Automation
Salary Histogram in the North of England

Salary distribution for jobs citing Test Automation in the North of England over the 6 months to 13 July 2025.

Salary histogram for Test Automation in the North of England

Test Automation
Job Locations in the North of England

The table below looks at the demand and provides a guide to the median salaries quoted in IT jobs citing Test Automation within the North of England region over the 6 months to 13 July 2025. The 'Rank Change' column provides an indication of the change in demand within each location based on the same 6 month period last year.

Location Rank Change
on Same Period
Last Year
Matching
Permanent
IT Job Ads
Median Salary
Past 6 Months
Median Salary
% Change
on Same Period
Last Year
Live
Jobs
North West -26 215 £65,000 +13.04% 154
Yorkshire -11 60 £49,000 -10.91% 112
North East +44 24 £52,809 -19.33% 36
Test Automation
England

Test Automation
Co-occurring Skills and Capabilities in the North of England by Category

The follow tables expand on the table above by listing co-occurrences grouped by category. The same employment type, locality and period is covered with up to 20 co-occurrences shown in each of the following categories:

Application Platforms
1 62 (20.74%) Confluence
2 7 (2.34%) Apache Spark
3 5 (1.67%) SharePoint
4 4 (1.34%) Apache
4 4 (1.34%) SAS
5 2 (0.67%) Oracle SOA Suite
5 2 (0.67%) WebLogic
6 1 (0.33%) Apache Solr
6 1 (0.33%) CMS
6 1 (0.33%) Moodle
6 1 (0.33%) nginx
6 1 (0.33%) Oracle Workflow
6 1 (0.33%) Totara
Applications
1 4 (1.34%) Chatbot
Business Applications
1 3 (1.00%) Oracle BPM
2 2 (0.67%) Dynamics NAV
2 2 (0.67%) Payment Gateway
3 1 (0.33%) SAP S/4HANA
3 1 (0.33%) Siebel CRM
Cloud Services
1 170 (56.86%) AWS
2 167 (55.85%) Azure
3 87 (29.10%) GCP
4 17 (5.69%) Serverless
5 15 (5.02%) AWS Lambda
6 12 (4.01%) GitHub
6 12 (4.01%) SaaS
7 10 (3.34%) Azure Machine Learning
8 8 (2.68%) Google Kubernetes Engine
9 7 (2.34%) Azure DevOps
10 5 (1.67%) Apigee
11 4 (1.34%) AWS CloudFormation
11 4 (1.34%) Microsoft 365
11 4 (1.34%) OpenShift
11 4 (1.34%) Salesforce Service Cloud
12 3 (1.00%) Amazon EMR
13 2 (0.67%) Dynamics 365
13 2 (0.67%) GitHub Actions
13 2 (0.67%) Slack
13 2 (0.67%) Tricentis Tosca
Communications & Networking
1 8 (2.68%) TCP/IP
2 6 (2.01%) SAN
3 5 (1.67%) Firewall
3 5 (1.67%) Multicast
3 5 (1.67%) Network Security
4 4 (1.34%) BGP
4 4 (1.34%) DHCP
4 4 (1.34%) DNS
4 4 (1.34%) EIGRP
4 4 (1.34%) OSPF
4 4 (1.34%) VLAN
4 4 (1.34%) VPN
4 4 (1.34%) Wi-Fi
5 2 (0.67%) Modbus
Database & Business Intelligence
1 127 (42.47%) SQL Server
2 18 (6.02%) MongoDB
2 18 (6.02%) MySQL
2 18 (6.02%) NoSQL
3 11 (3.68%) DynamoDB
4 10 (3.34%) Cloud Spanner
4 10 (3.34%) PostgreSQL
5 5 (1.67%) Big Data
5 5 (1.67%) DB2
5 5 (1.67%) Relational Database
6 3 (1.00%) Amazon Athena
6 3 (1.00%) Oracle Database
6 3 (1.00%) Oracle Database 11g
6 3 (1.00%) Oracle Database 12c
7 2 (0.67%) Power BI
8 1 (0.33%) Data Lake
8 1 (0.33%) Elasticsearch
8 1 (0.33%) Redis
Development Applications
1 141 (47.16%) Selenium
2 139 (46.49%) JIRA
3 131 (43.81%) Cucumber
4 122 (40.80%) SonarQube
5 121 (40.47%) GitLab
5 121 (40.47%) Sonatype Nexus
6 118 (39.46%) Maven
7 115 (38.46%) Bitbucket
8 31 (10.37%) Git
9 23 (7.69%) Jenkins
10 14 (4.68%) Postman
11 9 (3.01%) JMeter
12 8 (2.68%) JUnit
13 6 (2.01%) Cypress.io
13 6 (2.01%) LoadRunner
14 5 (1.67%) SpecFlow
15 4 (1.34%) Appium
15 4 (1.34%) Fiddler
15 4 (1.34%) NUnit
15 4 (1.34%) Robot Framework
General
1 205 (68.56%) Finance
2 156 (52.17%) Banking
3 122 (40.80%) Inclusion and Diversity
4 78 (26.09%) Retail
5 72 (24.08%) Corporate Banking
5 72 (24.08%) Investment Banking
6 63 (21.07%) Social Skills
7 18 (6.02%) Analytical Skills
8 14 (4.68%) Games
9 13 (4.35%) Law
10 9 (3.01%) Manufacturing
11 8 (2.68%) Financial Institution
11 8 (2.68%) Mandarin Language
12 7 (2.34%) Documentation Skills
12 7 (2.34%) Public Sector
13 6 (2.01%) Marketing
14 5 (1.67%) Telecoms
15 4 (1.34%) Cantonese Language
16 3 (1.00%) Pharmaceutical
17 2 (0.67%) Front Office
Job Titles
1 147 (49.16%) Software Engineer
2 61 (20.40%) Senior
3 38 (12.71%) Developer
4 25 (8.36%) Lead
5 24 (8.03%) Senior Developer
6 17 (5.69%) Senior Software Engineer
7 14 (4.68%) Java Developer
8 13 (4.35%) Test Engineer
9 10 (3.34%) Test Automation Engineer
9 10 (3.34%) Tester
10 9 (3.01%) Senior Java Developer
10 9 (3.01%) Support Engineer
11 7 (2.34%) Data Engineer
11 7 (2.34%) Engineering Manager
11 7 (2.34%) PHP Developer
11 7 (2.34%) Senior Data Engineer
12 6 (2.01%) Analyst
12 6 (2.01%) Cloud Engineer
12 6 (2.01%) Front-End Developer (Client-Side Developer)
12 6 (2.01%) Quality Engineer
Libraries, Frameworks & Software Standards
1 155 (51.84%) React
2 145 (48.49%) Spring Boot
3 134 (44.82%) Spring
4 132 (44.15%) CSS
5 131 (43.81%) HTML
6 124 (41.47%) Kafka
7 114 (38.13%) Redux
8 113 (37.79%) JPA
9 96 (32.11%) RESTful
10 83 (27.76%) REST
11 78 (26.09%) CSS3
12 76 (25.42%) HTML5
12 76 (25.42%) Jest
13 72 (24.08%) Sass
14 46 (15.38%) Hibernate
15 22 (7.36%) Node.js
16 18 (6.02%) Playwright
17 13 (4.35%) .NET
18 11 (3.68%) AngularJS
19 9 (3.01%) Amazon Corretto
Miscellaneous
1 126 (42.14%) Product Ownership
2 115 (38.46%) Enterprise Software
3 15 (5.02%) Public Cloud
4 13 (4.35%) Algorithms
5 10 (3.34%) Distributed Systems
6 9 (3.01%) Cloud Native
6 9 (3.01%) e-Learning
7 7 (2.34%) Replication
7 7 (2.34%) Wiki
8 5 (1.67%) Enterprise Storage
8 5 (1.67%) Onboarding
9 4 (1.34%) Credit Risk
9 4 (1.34%) Derivative
9 4 (1.34%) Fixed Income
9 4 (1.34%) FMCG
9 4 (1.34%) Linux Command Line
9 4 (1.34%) Management Information System
9 4 (1.34%) Market Risk
9 4 (1.34%) Mobile App
9 4 (1.34%) Virtual Team
Operating Systems
1 16 (5.35%) Windows
2 15 (5.02%) Linux
3 5 (1.67%) Unix
3 5 (1.67%) Windows 10
3 5 (1.67%) Windows Server
3 5 (1.67%) Windows Server 2012
3 5 (1.67%) Windows Server 2016
3 5 (1.67%) Windows Server 2019
4 1 (0.33%) Android
4 1 (0.33%) VMS
Processes & Methodologies
1 200 (66.89%) Agile
2 185 (61.87%) DevOps
3 171 (57.19%) CI/CD
4 167 (55.85%) Software Engineering
5 147 (49.16%) Microservices
6 134 (44.82%) Containerisation
6 134 (44.82%) Full-Stack Development
7 129 (43.14%) Front End Development
8 123 (41.14%) SDLC
9 116 (38.80%) Performance Optimisation
10 114 (38.13%) Mentoring
11 103 (34.45%) User Experience
12 86 (28.76%) TDD
13 85 (28.43%) Migration
14 76 (25.42%) Responsive Web Design
15 72 (24.08%) Strategic Thinking
16 63 (21.07%) Continuous Improvement
17 58 (19.40%) Clean Code
18 56 (18.73%) Problem-Solving
19 34 (11.37%) Code Quality
Programming Languages
1 182 (60.87%) Java
2 166 (55.52%) JavaScript
3 148 (49.50%) SQL
4 106 (35.45%) TypeScript
5 47 (15.72%) Python
6 24 (8.03%) C#
7 11 (3.68%) PHP
8 10 (3.34%) PowerShell
9 7 (2.34%) Go
9 7 (2.34%) Scala
10 4 (1.34%) Bash
10 4 (1.34%) Groovy
10 4 (1.34%) R
11 2 (0.67%) C
12 1 (0.33%) Kotlin
Qualifications
1 29 (9.70%) Degree
2 10 (3.34%) ISTQB
3 8 (2.68%) Computer Science Degree
4 7 (2.34%) DBS Check
5 5 (1.67%) Security Cleared
6 4 (1.34%) ISTQB Foundation Certification
7 3 (1.00%) OCP
7 3 (1.00%) Oracle Certification
7 3 (1.00%) SC Cleared
8 2 (0.67%) AWS Certification
8 2 (0.67%) AWS Certified Cloud Practitioner
9 1 (0.33%) BPSS Clearance
9 1 (0.33%) Numerate Degree
Quality Assurance & Compliance
1 145 (48.49%) QA
2 77 (25.75%) Accessibility
3 6 (2.01%) GDPR
4 4 (1.34%) Basel II
4 4 (1.34%) Basel III
4 4 (1.34%) Dodd-Frank
4 4 (1.34%) IFRS
4 4 (1.34%) IFRS 9
4 4 (1.34%) ISO 9001
4 4 (1.34%) PCI DSS
5 3 (1.00%) ISO/IEC 27001
6 1 (0.33%) California Consumer Privacy Act
6 1 (0.33%) NIST
6 1 (0.33%) SEPA
System Software
1 157 (52.51%) Docker
2 5 (1.67%) Active Directory
2 5 (1.67%) Hyper-V
3 4 (1.34%) VMware Infrastructure
3 4 (1.34%) VMware NSX
Systems Management
1 160 (53.51%) Kubernetes
2 27 (9.03%) Terraform
3 9 (3.01%) Ansible
4 8 (2.68%) Istio
5 6 (2.01%) Grafana
6 4 (1.34%) Microsoft Intune
6 4 (1.34%) Progress Chef
7 3 (1.00%) Argo
7 3 (1.00%) Prometheus
8 2 (0.67%) Functional Safety
9 1 (0.33%) Puppet
9 1 (0.33%) vRealize
Vendors
1 112 (37.46%) Solace
2 16 (5.35%) Microsoft
3 12 (4.01%) Google
4 11 (3.68%) Oracle
5 10 (3.34%) Cisco
5 10 (3.34%) IBM
6 5 (1.67%) Bloomberg
6 5 (1.67%) Databricks
6 5 (1.67%) VMware
7 4 (1.34%) Palantir
7 4 (1.34%) Salesforce
7 4 (1.34%) Sophos
8 3 (1.00%) Atlassian
8 3 (1.00%) Dynatrace
9 2 (0.67%) Alteryx
9 2 (0.67%) Twitter
10 1 (0.33%) Brocade
10 1 (0.33%) EMC
10 1 (0.33%) HP
10 1 (0.33%) SAP