EDI Jobs in the South East

Electronic Data Interchange (EDI)
England > South East

The table below provides summary statistics for permanent job vacancies advertised in the South East requiring EDI skills. It includes a benchmarking guide to the annual salaries offered in vacancies that cited EDI over the 6 months leading up to 26 July 2024, comparing them to the same period in the previous two years.

6 months to
26 Jul 2024
Same period 2023 Same period 2022
Rank 253 302 400
Rank change year-on-year +49 +98 -20
Permanent jobs citing EDI 101 59 110
As % of all permanent jobs advertised in the South East 0.67% 0.51% 0.50%
As % of the Libraries, Frameworks & Software Standards category 3.71% 1.84% 1.47%
Number of salaries quoted 77 41 93
10th Percentile £25,030 £42,500 £32,500
25th Percentile £30,000 £46,686 £35,000
Median annual salary (50th Percentile) £44,089 £62,086 £50,845
Median % change year-on-year -28.99% +22.11% +19.63%
75th Percentile £52,500 £63,856 £64,000
90th Percentile £58,712 £73,750 £74,235
England median annual salary £44,982 £48,939 £50,960
% change year-on-year -8.09% -3.97% +13.24%

All Software Libraries and Frameworks
South East

EDI falls under the Software Libraries and Frameworks category. For comparison with the information above, the following table provides summary statistics for all permanent job vacancies requiring technical specification, industry standards, software libraries and framework skills in the South East.

Permanent vacancies with a requirement for technical specification, industry standards, software libraries and framework skills 2,723 3,206 7,464
As % of all permanent jobs advertised in the South East 18.04% 27.67% 33.83%
Number of salaries quoted 2,095 2,394 4,281
10th Percentile £36,250 £36,250 £35,000
25th Percentile £43,956 £47,500 £45,000
Median annual salary (50th Percentile) £55,000 £60,000 £57,500
Median % change year-on-year -8.33% +4.35% +9.52%
75th Percentile £70,000 £75,000 £72,500
90th Percentile £82,500 £90,000 £83,750
England median annual salary £60,000 £67,500 £65,000
% change year-on-year -11.11% +3.85% +8.33%

EDI
Job Vacancy Trend in the South East

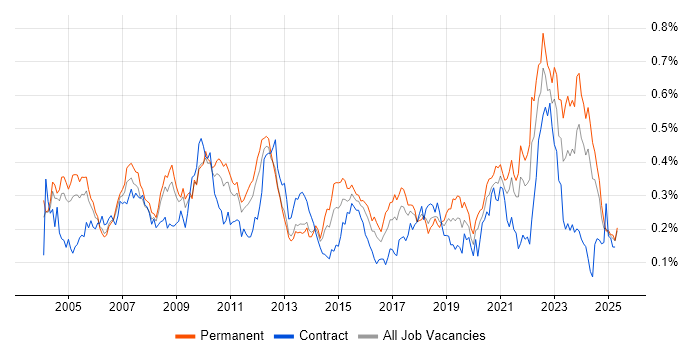
Job postings citing EDI as a proportion of all IT jobs advertised in the South East.

Job vacancy trend for EDI in the South East

EDI
Salary Trend in the South East

3-month moving average salary quoted in jobs citing EDI in the South East.

Salary trend for EDI in the South East

EDI
Salary Histogram in the South East

Salary distribution for jobs citing EDI in the South East over the 6 months to 26 July 2024.

Salary histogram for EDI in the South East

EDI
Job Locations in the South East

The table below looks at the demand and provides a guide to the median salaries quoted in IT jobs citing EDI within the South East region over the 6 months to 26 July 2024. The 'Rank Change' column provides an indication of the change in demand within each location based on the same 6 month period last year.

Location Rank Change
on Same Period
Last Year
Matching
Permanent
IT Job Ads
Median Salary
Past 6 Months
Median Salary
% Change
on Same Period
Last Year
Live
Jobs
Thames Valley +23 43 £46,293 -25.44% 7
Oxfordshire -10 40 £46,293 -25.44% 7
Kent +10 24 £30,000 -51.02% 3
Hampshire -12 22 £40,750 -18.50% 3
Surrey -19 6 £25,000 -54.95% 1
East Sussex - 4 - -
Buckinghamshire +5 2 - -
Middlesex - 2 £65,000 -
Berkshire +18 1 - -
EDI
England

EDI
Co-occurring Skills and Capabilities in the South East by Category

The follow tables expand on the table above by listing co-occurrences grouped by category. The same employment type, locality and period is covered with up to 20 co-occurrences shown in each of the following categories:

Application Platforms
1 4 (3.96%) SAS
2 2 (1.98%) CMS
2 2 (1.98%) WordPress
Applications
1 11 (10.89%) Microsoft Excel
2 9 (8.91%) Microsoft Office
2 9 (8.91%) Microsoft Project
Business Applications
1 9 (8.91%) Primavera
2 3 (2.97%) SAP MDM
3 1 (0.99%) SAP IBP
3 1 (0.99%) SAP S/4HANA
Cloud Services
1 7 (6.93%) Azure
2 5 (4.95%) AWS
2 5 (4.95%) GCP
3 2 (1.98%) Cloud Computing
3 2 (1.98%) Power Platform
3 2 (1.98%) PowerApps
Communications & Networking
1 4 (3.96%) FTP
1 4 (3.96%) HTTP
1 4 (3.96%) Modbus
1 4 (3.96%) SNMP
2 3 (2.97%) Firewall
2 3 (2.97%) LAN
2 3 (2.97%) Network Security
2 3 (2.97%) VLAN
2 3 (2.97%) VPN
2 3 (2.97%) WAN
Database & Business Intelligence
1 8 (7.92%) Big Data
2 4 (3.96%) Elasticsearch
3 2 (1.98%) Crystal Reports
3 2 (1.98%) RDBMS
3 2 (1.98%) Relational Database
3 2 (1.98%) SQL Server Integration Services
Development Applications
1 4 (3.96%) GitLab
2 2 (1.98%) Eclipse
General
1 27 (26.73%) Social Skills
2 12 (11.88%) Inclusion and Diversity
3 11 (10.89%) Finance
4 6 (5.94%) Retail
5 5 (4.95%) Analytical Skills
5 5 (4.95%) Legal
5 5 (4.95%) Presentation Skills
6 4 (3.96%) Korean Language
7 3 (2.97%) Marketing
8 2 (1.98%) Publishing
Job Titles
1 30 (29.70%) Project Manager
2 24 (23.76%) E-Commerce Manager
2 24 (23.76%) E-Commerce Project Manager
3 12 (11.88%) Analyst
4 9 (8.91%) EDI Specialist
4 9 (8.91%) Lead
5 8 (7.92%) Administrator
5 8 (7.92%) EDI Administrator
5 8 (7.92%) Project Leader
5 8 (7.92%) Project Planner
6 6 (5.94%) Business Systems Analyst
6 6 (5.94%) Junior
6 6 (5.94%) Systems Analyst
7 4 (3.96%) Linux/Unix DevOps
8 3 (2.97%) Network Engineer
8 3 (2.97%) Senior
9 2 (1.98%) Analyst Programmer
9 2 (1.98%) Applications Support Analyst
9 2 (1.98%) IT Manager
9 2 (1.98%) Programmer
Libraries, Frameworks & Software Standards
1 6 (5.94%) JSON
1 6 (5.94%) XML
2 5 (4.95%) IDoc
3 4 (3.96%) .NET
3 4 (3.96%) EDIFACT
4 2 (1.98%) CSS
4 2 (1.98%) HTML
4 2 (1.98%) Next.js
4 2 (1.98%) OpenMP
4 2 (1.98%) React
4 2 (1.98%) REST
4 2 (1.98%) Web Services
4 2 (1.98%) XSL
Miscellaneous
1 28 (27.72%) Onboarding
2 6 (5.94%) Algorithms
3 4 (3.96%) Data Centre
3 4 (3.96%) Distributed Systems
3 4 (3.96%) Management Information System
3 4 (3.96%) Raspberry Pi
4 3 (2.97%) Analytical Mindset
4 3 (2.97%) Distributed Computing
5 2 (1.98%) CUDA
5 2 (1.98%) Fat Client
5 2 (1.98%) Graphic Design
5 2 (1.98%) Grid Computing
5 2 (1.98%) SWIFT Messaging Network
5 2 (1.98%) Thin Client
6 1 (0.99%) Device Driver
6 1 (0.99%) Legacy Systems
6 1 (0.99%) Life Science
6 1 (0.99%) Self-Motivation
Operating Systems
1 12 (11.88%) Windows
2 7 (6.93%) Linux
3 4 (3.96%) CentOS
3 4 (3.96%) Red Hat Enterprise Linux
4 3 (2.97%) Unix
5 2 (1.98%) VMS
6 1 (0.99%) Mac OS
6 1 (0.99%) Windows 10
6 1 (0.99%) Windows Server
Processes & Methodologies
1 48 (47.52%) Project Management
2 28 (27.72%) Agile
3 24 (23.76%) Client Onboarding
3 24 (23.76%) E-Commerce
4 20 (19.80%) PRINCE2
5 13 (12.87%) Continuous Improvement
6 11 (10.89%) Artificial Intelligence
7 9 (8.91%) Cybersecurity
7 9 (8.91%) ITIL
7 9 (8.91%) Machine Learning
8 8 (7.92%) Community of Practice
8 8 (7.92%) E-business
8 8 (7.92%) Economics
8 8 (7.92%) Proactive Monitoring
8 8 (7.92%) Project Planning
8 8 (7.92%) Work Breakdown Structure
9 7 (6.93%) Project Delivery
9 7 (6.93%) SDLC
9 7 (6.93%) Systems Analysis
10 6 (5.94%) Service Delivery
Programming Languages
1 11 (10.89%) Python
2 10 (9.90%) SQL
3 9 (8.91%) Bash
4 7 (6.93%) PowerShell
5 6 (5.94%) PHP
6 4 (3.96%) ActionScript
6 4 (3.96%) ActionScript 2.0
6 4 (3.96%) C++
6 4 (3.96%) Perl
6 4 (3.96%) Shell Script
6 4 (3.96%) VB
6 4 (3.96%) VBScript
7 3 (2.97%) C
7 3 (2.97%) Fortran
8 2 (1.98%) C-shell
8 2 (1.98%) JavaScript
8 2 (1.98%) RPG
9 1 (0.99%) Java
9 1 (0.99%) Julia
9 1 (0.99%) R
Qualifications
1 23 (22.77%) Degree
2 16 (15.84%) BPSS Clearance
3 11 (10.89%) DBS Check
4 10 (9.90%) Security Cleared
5 9 (8.91%) SC Cleared
6 8 (7.92%) APMG
7 5 (4.95%) CCNA
7 5 (4.95%) Cisco Certification
8 4 (3.96%) CTC Cleared
8 4 (3.96%) DV Cleared
9 3 (2.97%) Network+ Certification
10 2 (1.98%) AWS Certification
10 2 (1.98%) Azure Certification
10 2 (1.98%) CompTIA Security+
10 2 (1.98%) Computer Science Degree
10 2 (1.98%) Master's Degree
10 2 (1.98%) PhD
11 1 (0.99%) HNC
Quality Assurance & Compliance
1 5 (4.95%) Sarbanes-Oxley
2 4 (3.96%) GDPR
3 1 (0.99%) QA
System Software
1 4 (3.96%) Docker
Systems Management
1 4 (3.96%) Cacti
1 4 (3.96%) Grafana
1 4 (3.96%) Nagios
Vendors
1 22 (21.78%) Microsoft
2 12 (11.88%) SAP
3 11 (10.89%) Sun
4 8 (7.92%) OpenText
5 4 (3.96%) Salesforce
6 2 (1.98%) Adobe
6 2 (1.98%) IBM
7 1 (0.99%) Dell
7 1 (0.99%) Oracle