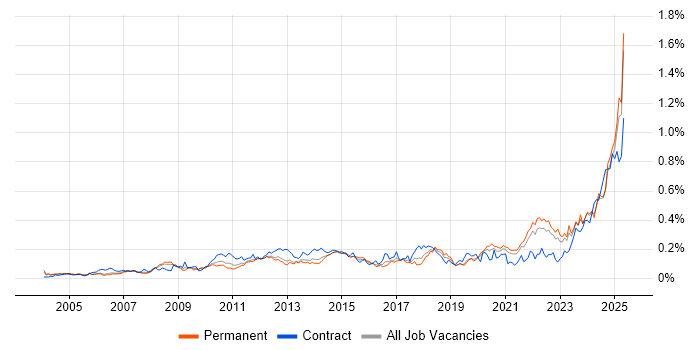
Performance Metrics Jobs in the South East

Performance Metrics
England > South East

The table below provides summary statistics for permanent job vacancies advertised in the South East requiring Performance Metrics skills. It includes a benchmarking guide to the annual salaries offered in vacancies that cited Performance Metrics over the 6 months leading up to 16 July 2025, comparing them to the same period in the previous two years.

6 months to
16 Jul 2025
Same period 2024 Same period 2023
Rank 216 315 338
Rank change year-on-year +99 +23 +60
Permanent jobs citing Performance Metrics 97 72 34
As % of all permanent jobs advertised in the South East 0.95% 0.42% 0.28%
As % of the Processes & Methodologies category 1.06% 0.51% 0.30%
Number of salaries quoted 26 31 31
10th Percentile £29,750 £31,250 £35,840
25th Percentile £34,063 £36,250 £41,250
Median annual salary (50th Percentile) £52,500 £45,000 £45,000
Median % change year-on-year +16.67% - -10.00%
75th Percentile £70,738 £68,750 £75,000
90th Percentile £74,000 £80,000 -
England median annual salary £51,500 £55,000 £57,500
% change year-on-year -6.36% -4.35% +2.22%

All Process and Methodology Skills
South East

Performance Metrics falls under the Processes and Methodologies category. For comparison with the information above, the following table provides summary statistics for all permanent job vacancies requiring process or methodology skills in the South East.

Permanent vacancies with a requirement for process or methodology skills 9,162 14,128 11,486
As % of all permanent jobs advertised in the South East 89.97% 81.81% 95.04%
Number of salaries quoted 4,815 9,674 7,278
10th Percentile £28,100 £28,250 £30,500
25th Percentile £37,500 £37,500 £41,250
Median annual salary (50th Percentile) £55,000 £50,000 £55,000
Median % change year-on-year +10.00% -9.09% -
75th Percentile £70,000 £65,000 £72,500
90th Percentile £80,000 £80,000 £85,000
England median annual salary £55,000 £55,000 £62,500
% change year-on-year - -12.00% +4.17%

Performance Metrics
Job Vacancy Trend in the South East

Job postings citing Performance Metrics as a proportion of all IT jobs advertised in the South East.

Job vacancy trend for Performance Metrics in the South East

Performance Metrics
Salary Trend in the South East

3-month moving average salary quoted in jobs citing Performance Metrics in the South East.

Salary trend for Performance Metrics in the South East

Performance Metrics
Salary Histogram in the South East

Salary distribution for jobs citing Performance Metrics in the South East over the 6 months to 16 July 2025.

Salary histogram for Performance Metrics in the South East

Performance Metrics
Job Locations in the South East

The table below looks at the demand and provides a guide to the median salaries quoted in IT jobs citing Performance Metrics within the South East region over the 6 months to 16 July 2025. The 'Rank Change' column provides an indication of the change in demand within each location based on the same 6 month period last year.

Location Rank Change
on Same Period
Last Year
Matching
Permanent
IT Job Ads
Median Salary
Past 6 Months
Median Salary
% Change
on Same Period
Last Year
Live
Jobs
Thames Valley +59 53 £49,000 -48.42% 49
Berkshire +40 38 £49,000 -48.42% 15
Surrey +64 21 £57,500 +15.00% 6
Hampshire +76 12 £72,000 +40.49% 6
Oxfordshire +45 11 £43,250 - 12
Buckinghamshire +27 4 - - 24
Middlesex -8 4 - -
West Sussex +25 3 £32,500 -53.57% 6
Kent +22 3 - - 5
East Sussex - 1 £32,500 - 3
Performance Metrics
England

Performance Metrics
Co-occurring Skills and Capabilities in the South East by Category

The follow tables expand on the table above by listing co-occurrences grouped by category. The same employment type, locality and period is covered with up to 20 co-occurrences shown in each of the following categories:

Application Platforms
1 3 (3.09%) SugarCRM
2 1 (1.03%) Confluence
Applications
1 2 (2.06%) Adobe Premiere
1 2 (2.06%) Final Cut Pro
1 2 (2.06%) Microsoft Office
2 1 (1.03%) Adobe Creative Suite
2 1 (1.03%) Photoshop
Business Applications
1 4 (4.12%) Magento
1 4 (4.12%) Shopify
Cloud Services
1 28 (28.87%) Azure
2 27 (27.84%) AWS
3 25 (25.77%) AWS Lambda
3 25 (25.77%) GCP
3 25 (25.77%) Serverless
4 3 (3.09%) Power Platform
5 2 (2.06%) Google Ads
5 2 (2.06%) Google Analytics
5 2 (2.06%) SaaS
5 2 (2.06%) Smartsheet
6 1 (1.03%) Canva
6 1 (1.03%) Microsoft 365
6 1 (1.03%) OCI
Communications & Networking
1 25 (25.77%) Broadband
2 5 (5.15%) Firewall
3 3 (3.09%) Network Security
4 1 (1.03%) 3G
4 1 (1.03%) GPRS
4 1 (1.03%) Intrusion Detection
4 1 (1.03%) LTE
4 1 (1.03%) Modbus
4 1 (1.03%) Wireless
Database & Business Intelligence
1 3 (3.09%) Power BI
2 2 (2.06%) Looker
3 1 (1.03%) DTS
Development Applications
1 3 (3.09%) JIRA
General
1 40 (41.24%) Analytical Skills
1 40 (41.24%) Law
2 33 (34.02%) Finance
3 25 (25.77%) Social Skills
4 16 (16.49%) Legal
5 15 (15.46%) Marketing
6 3 (3.09%) Health Technology
6 3 (3.09%) Presentation Skills
7 2 (2.06%) Retail
8 1 (1.03%) Advertising
8 1 (1.03%) Banking
8 1 (1.03%) Electronics
8 1 (1.03%) Games
8 1 (1.03%) Humanities
8 1 (1.03%) Inclusion and Diversity
8 1 (1.03%) Influencing Skills
8 1 (1.03%) Manufacturing
8 1 (1.03%) Organisational Skills
8 1 (1.03%) Public Sector
8 1 (1.03%) Telecoms
Job Titles
1 27 (27.84%) Senior
2 25 (25.77%) Machine Learning Engineer
3 22 (22.68%) Product Manager
4 7 (7.22%) Developer
5 6 (6.19%) E-Commerce Executive
6 5 (5.15%) Lead
7 4 (4.12%) Project Manager
7 4 (4.12%) SOC Manager
8 3 (3.09%) IT Director
8 3 (3.09%) IT Manager
8 3 (3.09%) Operational Security Manager
8 3 (3.09%) Operations Manager
8 3 (3.09%) Security Manager
8 3 (3.09%) Security Operations Manager
8 3 (3.09%) Services Director
9 2 (2.06%) Analyst
9 2 (2.06%) PPC Executive
9 2 (2.06%) Service Desk Manager
9 2 (2.06%) Service Manager
10 1 (1.03%) Senior Manager
Libraries, Frameworks & Software Standards
1 3 (3.09%) FHIR
Miscellaneous
1 25 (25.77%) Self-Motivation
2 21 (21.65%) Product Ownership
3 18 (18.56%) FMCG
4 17 (17.53%) PMI
5 5 (5.15%) Cyber Defence
6 4 (4.12%) Analytical Mindset
6 4 (4.12%) Cyber Threat
6 4 (4.12%) Security Operations Centre
7 3 (3.09%) CMDB
7 3 (3.09%) Management Information System
7 3 (3.09%) Onboarding
7 3 (3.09%) Social Media
8 2 (2.06%) Video Editing
8 2 (2.06%) Virtual Team
9 1 (1.03%) Enterprise Software
9 1 (1.03%) Graphic Design
9 1 (1.03%) IoT
9 1 (1.03%) NB-IoT
9 1 (1.03%) Public Cloud
9 1 (1.03%) Security Posture
Operating Systems
1 1 (1.03%) Linux
1 1 (1.03%) Windows
Processes & Methodologies
1 50 (51.55%) Agile
2 39 (40.21%) Continuous Improvement
3 38 (39.18%) Mentoring
4 36 (37.11%) Problem-Solving
5 32 (32.99%) Coaching
6 30 (30.93%) Data Science
7 26 (26.80%) Analytics
7 26 (26.80%) Creative Thinking
8 25 (25.77%) CI/CD
8 25 (25.77%) Clean Code
8 25 (25.77%) Machine Learning
8 25 (25.77%) Personalization
9 23 (23.71%) Budget Management
9 23 (23.71%) ITIL
10 22 (22.68%) Product Management
11 21 (21.65%) Service Management
11 21 (21.65%) Stakeholder Management
12 20 (20.62%) Scrum
13 19 (19.59%) Business Strategy
14 17 (17.53%) Customer-Centricity
Programming Languages
1 30 (30.93%) Python
2 25 (25.77%) TypeScript
3 5 (5.15%) MATLAB
Qualifications
1 58 (59.79%) Degree
2 25 (25.77%) PhD
3 19 (19.59%) Master's Degree
4 18 (18.56%) PMI Certification
5 5 (5.15%) CISM
5 5 (5.15%) CISSP
5 5 (5.15%) GIAC
6 4 (4.12%) GCIH
6 4 (4.12%) PRINCE2 Certification
7 3 (3.09%) HNC
7 3 (3.09%) Six Sigma Black Belt
7 3 (3.09%) Six Sigma Green Belt
7 3 (3.09%) Six Sigma Master Black Belt
8 2 (2.06%) ITIL Certification
9 1 (1.03%) CISA
9 1 (1.03%) Computer Science Degree
9 1 (1.03%) CREST Certified
9 1 (1.03%) ITIL Foundation Certificate
9 1 (1.03%) PMP
9 1 (1.03%) Postgraduate
Quality Assurance & Compliance
1 9 (9.28%) ISO/IEC 27001
2 4 (4.12%) NIST
3 3 (3.09%) 21 CFR Part 11
3 3 (3.09%) Good Clinical Practice
4 1 (1.03%) GRC
4 1 (1.03%) QA
4 1 (1.03%) SLA
Vendors
1 6 (6.19%) Microsoft
2 3 (3.09%) Adobe
3 2 (2.06%) Cisco
3 2 (2.06%) Facebook
3 2 (2.06%) Google
3 2 (2.06%) Instagram
3 2 (2.06%) ServiceNow
3 2 (2.06%) YouTube
4 1 (1.03%) SAP