Manufacturing Jobs in the South East

Manufacturing
England > South East

The table below looks at the prevalence of the term Manufacturing in permanent job vacancies in the South East. Included is a benchmarking guide to the salaries offered in vacancies that cited Manufacturing over the 6 months leading up to 30 May 2025, comparing them to the same period in the previous two years.

6 months to
30 May 2025
Same period 2024 Same period 2023
Rank 10 43 90
Rank change year-on-year +33 +47 +16
Permanent jobs citing Manufacturing 1,150 825 485
As % of all permanent jobs advertised in the South East 11.94% 4.70% 3.45%
As % of the General category 17.43% 8.40% 5.45%
Number of salaries quoted 133 439 203
10th Percentile £33,750 £27,500 £29,925
25th Percentile £42,000 £32,500 £41,250
Median annual salary (50th Percentile) £65,000 £42,300 £50,000
Median % change year-on-year +53.66% -15.40% -4.76%
75th Percentile £70,000 £55,000 £66,250
90th Percentile £79,750 £68,750 £85,000
England median annual salary £52,500 £45,000 £55,000
% change year-on-year +16.67% -18.18% +10.00%

All General Skills
South East

Manufacturing falls under the General Skills category. For comparison with the information above, the following table provides summary statistics for all permanent job vacancies requiring common skills in the South East.

Permanent vacancies with a requirement for common skills 6,596 9,822 8,898
As % of all permanent jobs advertised in the South East 68.46% 56.00% 63.36%
Number of salaries quoted 2,749 6,125 4,315
10th Percentile £27,500 £25,750 £28,500
25th Percentile £37,500 £32,500 £37,500
Median annual salary (50th Percentile) £55,000 £47,500 £52,500
Median % change year-on-year +15.79% -9.52% -2.78%
75th Percentile £70,000 £62,500 £70,000
90th Percentile £78,750 £75,000 £85,000
England median annual salary £56,000 £52,500 £60,000
% change year-on-year +6.67% -12.50% -

Manufacturing
Job Vacancy Trend in the South East

Job postings citing Manufacturing as a proportion of all IT jobs advertised in the South East.
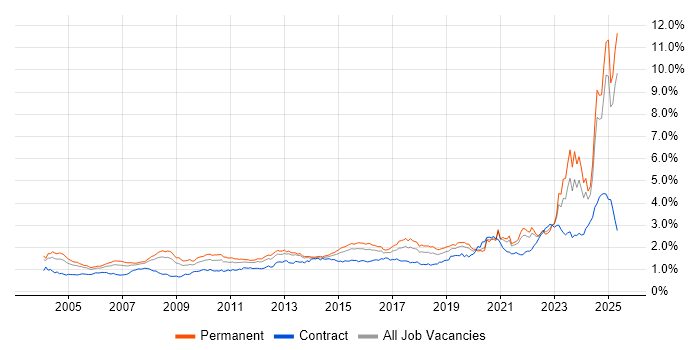
Job vacancy trend for Manufacturing in the South East

Manufacturing
Salary Trend in the South East

3-month moving average salary quoted in jobs citing Manufacturing in the South East.

Salary trend for Manufacturing in the South East

Manufacturing
Salary Histogram in the South East

Salary distribution for jobs citing Manufacturing in the South East over the 6 months to 30 May 2025.

Salary histogram for Manufacturing in the South East

Manufacturing
Job Locations in the South East

The table below looks at the demand and provides a guide to the median salaries quoted in IT jobs citing Manufacturing within the South East region over the 6 months to 30 May 2025. The 'Rank Change' column provides an indication of the change in demand within each location based on the same 6 month period last year.

Location Rank Change
on Same Period
Last Year
Matching
Permanent
IT Job Ads
Median Salary
Past 6 Months
Median Salary
% Change
on Same Period
Last Year
Live
Jobs
Thames Valley +42 631 £60,000 +33.33% 489
Buckinghamshire +24 281 £60,000 +54.84% 155
Berkshire +82 278 £55,000 +4.76% 239
Kent +65 124 £58,750 +54.61% 134
Surrey +43 124 £65,000 +36.84% 136
East Sussex +59 122 £55,000 +29.41% 66
Hampshire -5 111 £51,250 +21.16% 230
Oxfordshire +13 72 £65,000 +44.44% 102
Isle of Wight -62 30 £70,000 +64.71% 3
West Sussex +9 4 - - 79
Sussex +14 2 £42,500 +30.77% 9
Manufacturing
England

Manufacturing
Co-occurring Skills and Capabilities in the South East by Category

The follow tables expand on the table above by listing co-occurrences grouped by category. The same employment type, locality and period is covered with up to 20 co-occurrences shown in each of the following categories:

Application Platforms
1 10 (0.87%) SharePoint
2 3 (0.26%) Confluence
2 3 (0.26%) Microsoft Exchange
3 2 (0.17%) Skype for Business
Applications
1 76 (6.61%) Microsoft Office
2 4 (0.35%) Microsoft Excel
3 3 (0.26%) Microsoft PowerPoint
4 2 (0.17%) MS Visio
5 1 (0.087%) AutoCAD
5 1 (0.087%) Blender
5 1 (0.087%) CATIA
5 1 (0.087%) EPLAN
5 1 (0.087%) Microsoft Project
5 1 (0.087%) OrCAD
5 1 (0.087%) Siemens NX
5 1 (0.087%) Spreadsheet
Business Applications
1 13 (1.13%) NetSuite
2 11 (0.96%) Sage 200
2 11 (0.96%) Sage CRM
2 11 (0.96%) SAP S/4HANA
3 4 (0.35%) SAP IBP
3 4 (0.35%) SAP PP
4 2 (0.17%) Sage 1000
4 2 (0.17%) SAP EHS
5 1 (0.087%) Dynamics NAV
5 1 (0.087%) Oracle ERP
5 1 (0.087%) Salesforce CRM
5 1 (0.087%) SAP Business ByDesign
5 1 (0.087%) SAP Business One
5 1 (0.087%) SAP FI
5 1 (0.087%) SAP FSCM
5 1 (0.087%) TrackWise
Cloud Services
1 18 (1.57%) Azure
2 13 (1.13%) AWS
3 8 (0.70%) Azure DevOps
4 7 (0.61%) Microsoft 365
5 5 (0.43%) Collibra
5 5 (0.43%) Microsoft Purview
5 5 (0.43%) Power Platform
6 3 (0.26%) Amazon EC2
6 3 (0.26%) Amazon S3
6 3 (0.26%) Amazon SageMaker
6 3 (0.26%) Dynamics 365
7 2 (0.17%) Amazon ECR
7 2 (0.17%) Amazon EKS
7 2 (0.17%) Entra ID
7 2 (0.17%) GitHub
7 2 (0.17%) Power Automate
7 2 (0.17%) PowerApps
7 2 (0.17%) SaaS
7 2 (0.17%) Slack
7 2 (0.17%) Virtual Private Cloud
Communications & Networking
1 6 (0.52%) VPN
2 5 (0.43%) Firewall
3 4 (0.35%) Ethernet
3 4 (0.35%) Intrusion Detection
3 4 (0.35%) MQTT
3 4 (0.35%) Network Security
4 3 (0.26%) Modbus
5 2 (0.17%) RS-485
5 2 (0.17%) Wireless
6 1 (0.087%) 3G
6 1 (0.087%) Bluetooth
6 1 (0.087%) DHCP
6 1 (0.087%) DNS
6 1 (0.087%) GPRS
6 1 (0.087%) HTTP
6 1 (0.087%) Internet
6 1 (0.087%) Intranet
6 1 (0.087%) LAN
6 1 (0.087%) LTE
6 1 (0.087%) RS-232
Database & Business Intelligence
1 10 (0.87%) SQL Server
2 6 (0.52%) Relational Database
3 5 (0.43%) Data Warehouse
3 5 (0.43%) Power BI
4 4 (0.35%) SQL Server Integration Services
4 4 (0.35%) SQL Server Reporting Services
5 3 (0.26%) MongoDB
5 3 (0.26%) MySQL
6 2 (0.17%) Amazon RDS
6 2 (0.17%) NoSQL
6 2 (0.17%) SAP BW
6 2 (0.17%) SAP HANA
7 1 (0.087%) Big Data
7 1 (0.087%) PostgreSQL
7 1 (0.087%) SQLite
7 1 (0.087%) Tableau
Development Applications
1 13 (1.13%) Git
2 12 (1.04%) JIRA
3 4 (0.35%) Subversion
4 2 (0.17%) GitLab
4 2 (0.17%) Jenkins
4 2 (0.17%) JMeter
4 2 (0.17%) Robot Framework
General
1 246 (21.39%) Retail
2 126 (10.96%) Inclusion and Diversity
3 103 (8.96%) Social Skills
4 65 (5.65%) Finance
5 64 (5.57%) Dutch Language
5 64 (5.57%) Finnish Language
5 64 (5.57%) Norwegian Language
6 60 (5.22%) Electronics
7 35 (3.04%) Analytical Skills
8 19 (1.65%) Marketing
8 19 (1.65%) Public Sector
9 16 (1.39%) Catalan Language
9 16 (1.39%) Telecoms
10 12 (1.04%) Automotive
11 11 (0.96%) Aerospace
12 8 (0.70%) Pharmaceutical
13 7 (0.61%) Aviation
13 7 (0.61%) Law
13 7 (0.61%) Legal
14 5 (0.43%) Documentation Skills
Job Titles
1 240 (20.87%) Trainer
2 66 (5.74%) Test Engineer
3 64 (5.57%) Electrical Engineer
3 64 (5.57%) Safety Engineer
4 59 (5.13%) Senior
5 56 (4.87%) Technical Support
6 51 (4.43%) Support Technician
7 31 (2.70%) Engineering Manager
8 30 (2.61%) Design Engineer
8 30 (2.61%) Electronics Engineer
9 26 (2.26%) Electronics Design Engineer
9 26 (2.26%) PCB Design Engineer
9 26 (2.26%) PCB Engineer
10 24 (2.09%) Associate Engineer
11 17 (1.48%) Lead
12 14 (1.22%) Business Development Manager
12 14 (1.22%) Business Manager
12 14 (1.22%) Development Manager
12 14 (1.22%) Software Engineer
13 12 (1.04%) Developer
Libraries, Frameworks & Software Standards
1 9 (0.78%) .NET
2 6 (0.52%) Middleware
3 4 (0.35%) Yocto
4 3 (0.26%) ASP.NET
4 3 (0.26%) CSS
5 2 (0.17%) .NET Framework
5 2 (0.17%) Django
5 2 (0.17%) EDI
5 2 (0.17%) Flask
5 2 (0.17%) HTML
5 2 (0.17%) Lambda Expressions
5 2 (0.17%) OpenEmbedded
5 2 (0.17%) Playwright
5 2 (0.17%) React
5 2 (0.17%) REST
5 2 (0.17%) SAP XI
6 1 (0.087%) Entity Framework
6 1 (0.087%) Laravel
6 1 (0.087%) RabbitMQ
6 1 (0.087%) WPF
Miscellaneous
1 245 (21.30%) Robotics
2 13 (1.13%) Algorithms
2 13 (1.13%) Operational Technology
2 13 (1.13%) Self-Motivation
3 12 (1.04%) SCADA
4 9 (0.78%) Renewable Energy
5 8 (0.70%) Life Science
5 8 (0.70%) Onboarding
6 7 (0.61%) IoT
7 6 (0.52%) Biopharmaceutical
7 6 (0.52%) Embedded Systems
7 6 (0.52%) FMCG
7 6 (0.52%) FPGA
8 5 (0.43%) Molecular Biology
9 4 (0.35%) CCTV
9 4 (0.35%) CPLD
9 4 (0.35%) Driving Licence
9 4 (0.35%) Security Posture
10 3 (0.26%) Enterprise Software
10 3 (0.26%) Linux Command Line
Operating Systems
1 15 (1.30%) Windows
2 11 (0.96%) Windows Server
3 8 (0.70%) Linux
4 4 (0.35%) Windows 10
5 3 (0.26%) Debian
5 3 (0.26%) Windows Server 2019
6 1 (0.087%) Android
6 1 (0.087%) Apple iOS
6 1 (0.087%) Robot Operating System
6 1 (0.087%) Windows Server 2012
Processes & Methodologies
1 580 (50.43%) Service Delivery
2 292 (25.39%) Problem-Solving
3 260 (22.61%) Artificial Intelligence
4 250 (21.74%) Machine Learning
5 240 (20.87%) Generative AI
5 240 (20.87%) LLM
5 240 (20.87%) Red Team
6 177 (15.39%) Data Privacy
7 91 (7.91%) Mentoring
8 77 (6.70%) Coaching
9 66 (5.74%) Customer Service
10 64 (5.57%) Safety Engineering
11 57 (4.96%) Project Management
12 51 (4.43%) Customer Experience
12 51 (4.43%) Technical Analysis
13 49 (4.26%) Project Delivery
14 40 (3.48%) CAD
14 40 (3.48%) ERP
15 36 (3.13%) Design for Manufacturing
16 33 (2.87%) Business Intelligence
Programming Languages
1 31 (2.70%) SQL
2 22 (1.91%) C#
2 22 (1.91%) Python
3 13 (1.13%) C++
4 11 (0.96%) C
5 7 (0.61%) T-SQL
6 6 (0.52%) VB.NET
7 5 (0.43%) JavaScript
8 4 (0.35%) R
9 2 (0.17%) MATLAB
9 2 (0.17%) PowerShell
9 2 (0.17%) Shell Script
9 2 (0.17%) TypeScript
9 2 (0.17%) VBA
9 2 (0.17%) X++
10 1 (0.087%) ABAP
10 1 (0.087%) Embedded C
10 1 (0.087%) Java
10 1 (0.087%) PHP
10 1 (0.087%) VB
Qualifications
1 523 (45.48%) NVQ Level 3
2 435 (37.83%) Degree
3 58 (5.04%) NVQ Level 4
4 35 (3.04%) Chartered Engineer
5 30 (2.61%) BPSS Clearance
6 26 (2.26%) HND
7 21 (1.83%) Master's Degree
8 9 (0.78%) Computer Science Degree
9 7 (0.61%) PMP
10 5 (0.43%) MBA
11 4 (0.35%) HNC
12 3 (0.26%) PhD
12 3 (0.26%) SC Cleared
12 3 (0.26%) Security Cleared
13 2 (0.17%) DBS Check
13 2 (0.17%) ISTQB
13 2 (0.17%) ISTQB Foundation Certification
13 2 (0.17%) Microsoft Certification
13 2 (0.17%) PMI Certification
14 1 (0.087%) ACCA
Quality Assurance & Compliance
1 37 (3.22%) QA
2 7 (0.61%) Data Quality
3 4 (0.35%) Accessibility
3 4 (0.35%) Cyber Essentials
3 4 (0.35%) GMP
3 4 (0.35%) ISO/IEC 27001
4 3 (0.26%) GRC
4 3 (0.26%) GxP
5 1 (0.087%) ECSS
5 1 (0.087%) GLP
5 1 (0.087%) ISO 9001
5 1 (0.087%) ISO/IEC 15288
5 1 (0.087%) PMO
5 1 (0.087%) Sarbanes-Oxley
5 1 (0.087%) SOC 2
System Software
1 7 (0.61%) VMware Infrastructure
2 6 (0.52%) Virtual Machines
3 5 (0.43%) Firmware
3 5 (0.43%) Hyper-V
4 2 (0.17%) Active Directory
4 2 (0.17%) VMware ESXi
5 1 (0.087%) Docker
5 1 (0.087%) Embedded Firmware
Systems Management
1 5 (0.43%) FortiGate
2 3 (0.26%) Kubernetes
3 2 (0.17%) Functional Safety
3 2 (0.17%) Kustomize
4 1 (0.087%) Microsoft Intune
Vendors
1 241 (20.96%) Databricks
2 240 (20.87%) Adobe
2 240 (20.87%) Google
3 100 (8.70%) Microsoft
4 29 (2.52%) EMC
5 26 (2.26%) SAP
6 13 (1.13%) Sage
7 9 (0.78%) Siemens
8 8 (0.70%) Rockwell
8 8 (0.70%) VMware
9 5 (0.43%) Infor
9 5 (0.43%) Informatica
10 4 (0.35%) Agilent
10 4 (0.35%) Fortinet
10 4 (0.35%) Salesforce
11 3 (0.26%) Epicor
12 2 (0.17%) AVEVA
12 2 (0.17%) Freescale
12 2 (0.17%) NVIDIA
12 2 (0.17%) RedGate