Continuous Improvement Jobs in the South West

Continual Improvement
England > South West

The table below provides summary statistics for permanent job vacancies advertised in the South West requiring Continuous Improvement skills. It includes a benchmarking guide to the annual salaries offered in vacancies that cited Continuous Improvement over the 6 months leading up to 14 May 2025, comparing them to the same period in the previous two years.

6 months to
14 May 2025
Same period 2024 Same period 2023
Rank 34 40 56
Rank change year-on-year +6 +16 +13
Permanent jobs citing Continuous Improvement 217 452 348
As % of all permanent jobs advertised in the South West 6.11% 4.89% 5.13%
As % of the Processes & Methodologies category 6.54% 5.85% 5.43%
Number of salaries quoted 143 351 196
10th Percentile £35,000 £35,000 £30,500
25th Percentile £37,574 £41,000 £37,250
Median annual salary (50th Percentile) £51,500 £52,396 £50,000
Median % change year-on-year -1.71% +4.79% +11.11%
75th Percentile £68,114 £65,000 £65,000
90th Percentile £86,500 £80,000 £80,750
England median annual salary £56,000 £57,500 £60,000
% change year-on-year -2.61% -4.17% -

All Process and Methodology Skills
South West

Continuous Improvement falls under the Processes and Methodologies category. For comparison with the information above, the following table provides summary statistics for all permanent job vacancies requiring process or methodology skills in the South West.

Permanent vacancies with a requirement for process or methodology skills 3,316 7,724 6,403
As % of all permanent jobs advertised in the South West 93.33% 83.50% 94.44%
Number of salaries quoted 1,901 5,557 3,595
10th Percentile £27,250 £28,500 £30,500
25th Percentile £37,000 £37,500 £38,750
Median annual salary (50th Percentile) £52,600 £51,000 £52,500
Median % change year-on-year +3.14% -2.86% +5.00%
75th Percentile £63,750 £65,000 £68,750
90th Percentile £77,500 £80,000 £80,627
England median annual salary £57,500 £55,000 £62,500
% change year-on-year +4.55% -12.00% +4.17%

Continuous Improvement
Job Vacancy Trend in the South West

Job postings citing Continuous Improvement as a proportion of all IT jobs advertised in the South West.
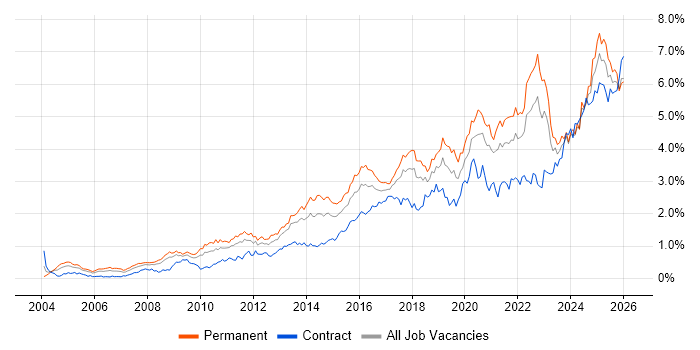
Job vacancy trend for Continuous Improvement in the South West

Continuous Improvement
Salary Trend in the South West

3-month moving average salary quoted in jobs citing Continuous Improvement in the South West.

Salary trend for Continuous Improvement in the South West

Continuous Improvement
Salary Histogram in the South West

Salary distribution for jobs citing Continuous Improvement in the South West over the 6 months to 14 May 2025.

Salary histogram for Continuous Improvement in the South West

Continuous Improvement
Job Locations in the South West

The table below looks at the demand and provides a guide to the median salaries quoted in IT jobs citing Continuous Improvement within the South West region over the 6 months to 14 May 2025. The 'Rank Change' column provides an indication of the change in demand within each location based on the same 6 month period last year.

Location Rank Change
on Same Period
Last Year
Matching
Permanent
IT Job Ads
Median Salary
Past 6 Months
Median Salary
% Change
on Same Period
Last Year
Live
Jobs
Bristol 0 76 £62,500 +8.70% 153
Wiltshire +22 58 £40,000 -26.63% 31
Somerset +1 22 £40,101 -23.62% 53
Gloucestershire +31 20 £55,000 +12.82% 123
Devon -13 17 £59,419 +26.54% 44
Dorset -3 14 £40,101 -33.72% 30
Cornwall +18 6 £51,250 +9.30% 6
Continuous Improvement
England

Continuous Improvement
Co-occurring Skills and Capabilities in the South West by Category

The follow tables expand on the table above by listing co-occurrences grouped by category. The same employment type, locality and period is covered with up to 20 co-occurrences shown in each of the following categories:

Application Platforms
1 15 (6.91%) OpenEdge
2 7 (3.23%) SharePoint
3 6 (2.76%) nginx
4 2 (0.92%) ArcGIS
4 2 (0.92%) Confluence
4 2 (0.92%) Microsoft Exchange
5 1 (0.46%) Apache Solr
5 1 (0.46%) Appian
5 1 (0.46%) Mendix
5 1 (0.46%) Oracle Workflow
Applications
1 20 (9.22%) Simulink
2 9 (4.15%) Microsoft Office
3 7 (3.23%) Microsoft Excel
4 6 (2.76%) Microsoft PowerPoint
5 1 (0.46%) Trello
Business Applications
1 20 (9.22%) Teamcenter
2 2 (0.92%) Infor CloudSuite
2 2 (0.92%) Infor CloudSuite Industrial (formerly SyteLine)
3 1 (0.46%) Dynamics AX
3 1 (0.46%) Oracle EBS
3 1 (0.46%) Oracle EBS R12
3 1 (0.46%) Oracle Procure-to-Pay
Cloud Services
1 24 (11.06%) AWS
2 23 (10.60%) Azure
3 14 (6.45%) Microsoft 365
4 10 (4.61%) Entra ID
5 9 (4.15%) SaaS
6 8 (3.69%) Cloud Computing
6 8 (3.69%) Power Platform
7 7 (3.23%) Collibra
8 6 (2.76%) PaaS
9 5 (2.30%) Amazon CloudWatch
9 5 (2.30%) AWS CloudTrail
10 4 (1.84%) OneDrive
11 3 (1.38%) Azure DevOps
11 3 (1.38%) IaaS
11 3 (1.38%) OCI
11 3 (1.38%) Serverless
12 2 (0.92%) Dynamics 365
12 2 (0.92%) GCP
13 1 (0.46%) Adobe Creative Cloud
13 1 (0.46%) Boomi
Communications & Networking
1 17 (7.83%) Firewall
2 13 (5.99%) Network Security
3 12 (5.53%) VPN
4 4 (1.84%) Intrusion Detection
4 4 (1.84%) WAN
5 3 (1.38%) DNS
5 3 (1.38%) LAN
5 3 (1.38%) SD-WAN
5 3 (1.38%) TCP/IP
5 3 (1.38%) VLAN
6 2 (0.92%) BGP
6 2 (0.92%) Wi-Fi
7 1 (0.46%) DHCP
7 1 (0.46%) EIGRP
7 1 (0.46%) HTTPS
7 1 (0.46%) IPsec
7 1 (0.46%) MPLS
7 1 (0.46%) OSPF
7 1 (0.46%) SAN
7 1 (0.46%) Wireless
Database & Business Intelligence
1 8 (3.69%) Power BI
2 7 (3.23%) Ataccama
2 7 (3.23%) Metadata
3 6 (2.76%) Amazon RDS
4 5 (2.30%) MariaDB
5 4 (1.84%) Metadata Repository
5 4 (1.84%) Tableau
6 2 (0.92%) GIS
6 2 (0.92%) QGIS
6 2 (0.92%) SQL Server
7 1 (0.46%) Amazon Aurora
7 1 (0.46%) Couchbase
7 1 (0.46%) Data Lake
7 1 (0.46%) Data Warehouse
7 1 (0.46%) DynamoDB
7 1 (0.46%) MongoDB
7 1 (0.46%) MySQL
7 1 (0.46%) NoSQL
7 1 (0.46%) Oracle Database
7 1 (0.46%) SQL Server Reporting Services
Development Applications
1 20 (9.22%) Rational DOORS
2 11 (5.07%) JIRA
3 3 (1.38%) Oracle Forms
4 1 (0.46%) GitLab
4 1 (0.46%) Jenkins
4 1 (0.46%) RStudio
4 1 (0.46%) Selenium
General
1 98 (45.16%) Social Skills
2 66 (30.41%) Finance
3 47 (21.66%) Manufacturing
4 30 (13.82%) Analytical Skills
5 23 (10.60%) Aerospace
6 22 (10.14%) Electronics
7 13 (5.99%) Inclusion and Diversity
8 12 (5.53%) Banking
9 8 (3.69%) Back Office
10 7 (3.23%) Marketing
10 7 (3.23%) Pharmaceutical
10 7 (3.23%) Public Sector
10 7 (3.23%) Retail
11 6 (2.76%) Organisational Skills
12 3 (1.38%) Telecoms
13 2 (0.92%) Documentation Skills
13 2 (0.92%) Law
13 2 (0.92%) Legal
13 2 (0.92%) Military
13 2 (0.92%) Police
Job Titles
1 26 (11.98%) Developer
2 24 (11.06%) Resource Manager
2 24 (11.06%) Systems Manager
3 22 (10.14%) Junior
3 22 (10.14%) Lead
3 22 (10.14%) Systems Engineer
4 20 (9.22%) ERP Developer
4 20 (9.22%) Junior Systems Engineer
4 20 (9.22%) Progress Developer
5 11 (5.07%) Quality Manager
6 10 (4.61%) Analyst
6 10 (4.61%) Senior
7 9 (4.15%) QA Manager
8 8 (3.69%) Cloud Engineer
8 8 (3.69%) Technical Manager
9 7 (3.23%) Desktop Support
9 7 (3.23%) Desktop Support Technician
9 7 (3.23%) Desktop Technician
9 7 (3.23%) Product Manager
9 7 (3.23%) Support Technician
Libraries, Frameworks & Software Standards
1 5 (2.30%) .NET
2 3 (1.38%) Oracle Fusion
2 3 (1.38%) React
3 2 (0.92%) .NET Core
3 2 (0.92%) AngularJS
3 2 (0.92%) Leaflet
3 2 (0.92%) Node.js
3 2 (0.92%) PyTorch
3 2 (0.92%) TensorFlow
4 1 (0.46%) ADO
4 1 (0.46%) CSS
4 1 (0.46%) HTML
4 1 (0.46%) jQuery
4 1 (0.46%) LEMP Stack
4 1 (0.46%) Playwright
4 1 (0.46%) RabbitMQ
4 1 (0.46%) RESTful
4 1 (0.46%) Spring
4 1 (0.46%) Spring Boot
Miscellaneous
1 10 (4.61%) Management Information System
2 8 (3.69%) Data Centre
3 5 (2.30%) CMDB
3 5 (2.30%) Product Ownership
4 4 (1.84%) Cyber Threat
4 4 (1.84%) Robotics
4 4 (1.84%) SCADA
5 3 (1.38%) Fibre Optics
5 3 (1.38%) Virtual Team
6 2 (0.92%) Algorithms
6 2 (0.92%) CCTV
6 2 (0.92%) CSOC
6 2 (0.92%) Data Protection Act
6 2 (0.92%) Lidar
6 2 (0.92%) Low-Code
6 2 (0.92%) Renewable Energy
6 2 (0.92%) Security Operations Centre
6 2 (0.92%) Security Posture
7 1 (0.46%) Podcast
7 1 (0.46%) Smartphone
Operating Systems
1 36 (16.59%) Windows
2 25 (11.52%) Linux
3 7 (3.23%) Windows 10
4 2 (0.92%) Windows Server
5 1 (0.46%) AIX
5 1 (0.46%) Mac OS
Processes & Methodologies
1 68 (31.34%) Problem-Solving
2 54 (24.88%) ERP
3 50 (23.04%) Analytics
4 49 (22.58%) Agile
5 37 (17.05%) Data Management
6 32 (14.75%) Customer Service
6 32 (14.75%) ITIL
7 29 (13.36%) Computer Science
7 29 (13.36%) Project Management
8 28 (12.90%) Service Delivery
9 27 (12.44%) Roadmaps
10 24 (11.06%) Mentoring
10 24 (11.06%) Systems Engineering
11 22 (10.14%) Process Improvement
12 20 (9.22%) Creative Problem-Solving
12 20 (9.22%) DevOps
12 20 (9.22%) Mathematics
12 20 (9.22%) Model-Based Systems Engineering
12 20 (9.22%) Physics
12 20 (9.22%) UML
Programming Languages
1 20 (9.22%) MATLAB
1 20 (9.22%) Progress 4GL
2 10 (4.61%) SQL
3 6 (2.76%) C#
3 6 (2.76%) Python
4 5 (2.30%) JavaScript
5 3 (1.38%) Java
5 3 (1.38%) VB.NET
6 2 (0.92%) VB
6 2 (0.92%) VB6
7 1 (0.46%) Bash
7 1 (0.46%) Data Analysis Expressions
7 1 (0.46%) PHP
7 1 (0.46%) PowerShell
7 1 (0.46%) R
7 1 (0.46%) Ruby
7 1 (0.46%) TypeScript
7 1 (0.46%) VBA
Qualifications
1 62 (28.57%) Degree
2 27 (12.44%) Security Cleared
3 25 (11.52%) BPSS Clearance
4 17 (7.83%) SC Cleared
5 10 (4.61%) CISM
5 10 (4.61%) CISSP
6 9 (4.15%) DV Cleared
7 8 (3.69%) Master's Degree
7 8 (3.69%) NVQ Level 3
7 8 (3.69%) NVQ Level 4
8 7 (3.23%) CTC Cleared
9 5 (2.30%) ITIL Certification
10 4 (1.84%) Cisco Certification
11 3 (1.38%) Computer Science Degree
11 3 (1.38%) GIAC
11 3 (1.38%) ITIL Foundation Certificate
11 3 (1.38%) SANS
12 2 (0.92%) CCNP
12 2 (0.92%) CEH
12 2 (0.92%) ISSAP
Quality Assurance & Compliance
1 29 (13.36%) SLA
2 20 (9.22%) QA
3 10 (4.61%) Data Quality
3 10 (4.61%) NIST
4 7 (3.23%) GDPR
4 7 (3.23%) GLP
4 7 (3.23%) GMP
5 6 (2.76%) Accessibility
5 6 (2.76%) NCSC
6 4 (1.84%) ISO 9001
7 3 (1.38%) ISO/IEC 27001
7 3 (1.38%) PCI DSS
8 2 (0.92%) Actionable Recommendations
8 2 (0.92%) COBIT
8 2 (0.92%) Cyber Essentials
8 2 (0.92%) Cyber Essentials PLUS
8 2 (0.92%) ISO 14001
8 2 (0.92%) SOC 2
9 1 (0.46%) NEBOSH
9 1 (0.46%) PMO
System Software
1 8 (3.69%) Active Directory
2 2 (0.92%) Docker
3 1 (0.46%) Snort
3 1 (0.46%) Virtual Servers
3 1 (0.46%) VMware Infrastructure
Systems Management
1 5 (2.30%) Kubernetes
2 4 (1.84%) Microsoft Intune
3 3 (1.38%) SCCM
4 1 (0.46%) Ansible
4 1 (0.46%) Backup Exec
4 1 (0.46%) Jamf Pro
4 1 (0.46%) NetBackup
4 1 (0.46%) Puppet
4 1 (0.46%) Systems Management Server (SMS)
4 1 (0.46%) Terraform
Vendors
1 44 (20.28%) Microsoft
2 21 (9.68%) IBM
3 20 (9.22%) Progress
4 10 (4.61%) Cisco
4 10 (4.61%) SAP
4 10 (4.61%) ServiceNow
5 8 (3.69%) Google
6 5 (2.30%) Oracle
7 4 (1.84%) Salesforce
7 4 (1.84%) VMware
8 3 (1.38%) Talend
9 2 (0.92%) Infor
9 2 (0.92%) Red Hat
10 1 (0.46%) Adobe
10 1 (0.46%) Apple
10 1 (0.46%) Fortinet
10 1 (0.46%) Hitachi
10 1 (0.46%) HP
10 1 (0.46%) NetApp
10 1 (0.46%) Veritas