Microsoft Office Jobs in the South West

Microsoft Office
England > South West

The following table provides summary statistics for permanent job vacancies advertised in the South West with a requirement for Microsoft Office skills. Included is a benchmarking guide to the salaries offered in vacancies that have cited Microsoft Office over the 6 months to 4 May 2024 with a comparison to the same period in the previous 2 years.

6 months to
4 May 2024
Same period 2023 Same period 2022
Rank 65 87 124
Rank change year-on-year +22 +37 -19
Permanent jobs citing Microsoft Office 348 244 228
As % of all permanent jobs advertised in the South West 3.77% 3.53% 2.84%
As % of the Applications category 42.54% 46.30% 37.13%
Number of salaries quoted 258 170 154
10th Percentile £24,577 £24,188 £21,613
25th Percentile £26,250 £27,500 £25,875
Median annual salary (50th Percentile) £32,500 £35,000 £32,500
Median % change year-on-year -7.14% +7.69% +4.46%
75th Percentile £43,750 £50,000 £42,875
90th Percentile £61,250 £55,000 £52,500
England median annual salary £32,500 £38,000 £37,500
% change year-on-year -14.47% +1.33% -1.32%

All Software Application Skills
South West

Microsoft Office is in the Software Applications category. The following table is for comparison with the above and provides summary statistics for all permanent job vacancies advertised in the South West with a requirement for software application skills.

Permanent vacancies with a requirement for software application skills 818 527 614
As % of all permanent jobs advertised in the South West 8.87% 7.62% 7.66%
Number of salaries quoted 565 313 364
10th Percentile £25,000 £25,000 £23,500
25th Percentile £29,290 £29,000 £30,504
Median annual salary (50th Percentile) £39,005 £37,500 £39,550
Median % change year-on-year +4.01% -5.18% -1.13%
75th Percentile £55,000 £50,750 £50,000
90th Percentile £65,000 £58,650 £57,500
England median annual salary £37,500 £45,000 £45,000
% change year-on-year -16.67% - +5.70%

Microsoft Office
Job Vacancy Trend in the South West

Job postings citing Microsoft Office as a proportion of all IT jobs advertised in the South West.
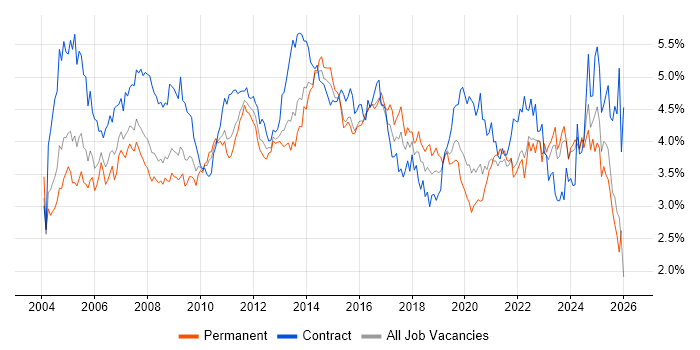
Job vacancy trend for Microsoft Office in the South West

Microsoft Office
Salary Trend in the South West

3-month moving average salary quoted in jobs citing Microsoft Office in the South West.

Salary trend for Microsoft Office in the South West

Microsoft Office
Salary Histogram in the South West

Salary distribution for jobs citing Microsoft Office in the South West over the 6 months to 4 May 2024.

Salary histogram for Microsoft Office in the South West

Microsoft Office
Job Locations in the South West

The table below looks at the demand and provides a guide to the median salaries quoted in IT jobs citing Microsoft Office within the South West region over the 6 months to 4 May 2024. The 'Rank Change' column provides an indication of the change in demand within each location based on the same 6 month period last year.

Location Rank Change
on Same Period
Last Year
Matching
Permanent
IT Job Ads
Median Salary
Past 6 Months
Median Salary
% Change
on Same Period
Last Year
Live
Jobs
Bristol +33 82 £45,000 +60.00% 59
Dorset +31 63 £41,250 +26.92% 12
Devon +18 50 £28,778 -30.66% 27
Somerset +16 48 £29,605 +0.36% 45
Wiltshire -15 47 £31,375 -22.05% 30
Gloucestershire -21 39 £30,750 -18.00% 31
Cornwall -13 18 £39,005 -2.49% 8
Microsoft Office
England

Microsoft Office
Co-occurring Skills and Capabilities in the South West by Category

The follow tables expand on the table above by listing co-occurrences grouped by category. The same employment type, locality and period is covered with up to 20 co-occurrences shown in each of the following categories:

Application Platforms
1 28 (8.05%) SharePoint
2 23 (6.61%) Microsoft Exchange
3 13 (3.74%) Confluence
4 5 (1.44%) IIS
5 4 (1.15%) Moodle
6 3 (0.86%) Apache
6 3 (0.86%) GlassFish
6 3 (0.86%) JBoss
6 3 (0.86%) Jupyter
6 3 (0.86%) Tomcat
7 1 (0.29%) Exchange Server 2010
7 1 (0.29%) SAS
Applications
1 67 (19.25%) Microsoft Excel
2 36 (10.34%) Microsoft PowerPoint
3 13 (3.74%) Microsoft Project
4 9 (2.59%) MS Visio
5 6 (1.72%) Trello
6 2 (0.57%) Spreadsheet
7 1 (0.29%) AutoCAD
7 1 (0.29%) Solid Edge
7 1 (0.29%) SOLIDWORKS
Business Applications
1 4 (1.15%) Primavera
2 3 (0.86%) Dynamics CRM
3 2 (0.57%) Infor CloudSuite Industrial (formerly SyteLine)
3 2 (0.57%) NetSuite
4 1 (0.29%) Dynamics AX
4 1 (0.29%) Maximo
4 1 (0.29%) Payment Gateway
4 1 (0.29%) SAP R/3
Cloud Services
1 55 (15.80%) Microsoft 365
2 53 (15.23%) Azure
3 11 (3.16%) Entra ID
3 11 (3.16%) Power Platform
4 8 (2.30%) AWS
4 8 (2.30%) GitHub
5 7 (2.01%) SaaS
6 6 (1.72%) Azure Sentinel
7 4 (1.15%) Dynamics 365
7 4 (1.15%) Smartsheet
8 3 (0.86%) Azure DevOps
8 3 (0.86%) OneDrive
9 2 (0.57%) Adobe Creative Cloud
9 2 (0.57%) Power Automate
9 2 (0.57%) PowerApps
10 1 (0.29%) Dropbox
10 1 (0.29%) Google Drive
10 1 (0.29%) Google Sheets
10 1 (0.29%) WhatsApp
Communications & Networking
1 20 (5.75%) Firewall
2 15 (4.31%) LAN
3 14 (4.02%) WAN
4 13 (3.74%) VPN
5 12 (3.45%) TCP/IP
6 11 (3.16%) Wireless
7 10 (2.87%) Network Security
8 9 (2.59%) DNS
9 8 (2.30%) Remote Desktop
10 6 (1.72%) Cisco IPT
10 6 (1.72%) DHCP
11 5 (1.44%) Internet
12 4 (1.15%) 5G
12 4 (1.15%) SD-WAN
13 3 (0.86%) Intranet
13 3 (0.86%) Reverse Proxy
13 3 (0.86%) SAN
13 3 (0.86%) Wi-Fi
14 2 (0.57%) IP Telephony
14 2 (0.57%) VLAN
Database & Business Intelligence
1 10 (2.87%) Power BI
1 10 (2.87%) Tableau
2 8 (2.30%) Electronic Patient Records
3 6 (1.72%) Big Data
3 6 (1.72%) Relational Database
3 6 (1.72%) Snowflake Schema
3 6 (1.72%) SQL Server
3 6 (1.72%) Star Schema
4 3 (0.86%) Data Mining
4 3 (0.86%) Oracle Database
4 3 (0.86%) Oracle Database 12c
4 3 (0.86%) Oracle Reports
5 2 (0.57%) Azure SQL Database
5 2 (0.57%) Data Vault
5 2 (0.57%) SQL Server Reporting Services
6 1 (0.29%) BusinessObjects
6 1 (0.29%) SAP BW
6 1 (0.29%) SQL Server Integration Services
Development Applications
1 25 (7.18%) JIRA
2 12 (3.45%) LabVIEW
3 8 (2.30%) Git
4 3 (0.86%) Team Foundation Server
4 3 (0.86%) Visual Studio
5 2 (0.57%) Rational DOORS
6 1 (0.29%) Rational Rhapsody
6 1 (0.29%) SQL Server Management Studio (SSMS)
General
1 170 (48.85%) Social Skills
2 93 (26.72%) Finance
3 68 (19.54%) Analytical Skills
4 42 (12.07%) Banking
5 33 (9.48%) Inclusion and Diversity
5 33 (9.48%) Law
6 31 (8.91%) Marketing
7 29 (8.33%) Retail
8 28 (8.05%) Organisational Skills
9 24 (6.90%) Investment Banking
10 23 (6.61%) Presentation Skills
11 19 (5.46%) Telecoms
12 18 (5.17%) Manufacturing
13 17 (4.89%) Legal
14 16 (4.60%) Public Sector
15 14 (4.02%) Aerospace
16 9 (2.59%) Military
17 8 (2.30%) Influencing Skills
18 5 (1.44%) Advertising
19 4 (1.15%) Electronics
Job Titles
1 45 (12.93%) Support Engineer
2 44 (12.64%) Analyst
3 39 (11.21%) IT Support
4 30 (8.62%) Administrator
5 24 (6.90%) Project Manager
6 23 (6.61%) Senior
7 22 (6.32%) IT Engineer
7 22 (6.32%) IT Support Engineer
8 18 (5.17%) Desktop Engineer
8 18 (5.17%) Desktop Support
8 18 (5.17%) Desktop Support Engineer
9 17 (4.89%) Consultant
10 16 (4.60%) Coordinator
11 15 (4.31%) Systems Engineer
12 13 (3.74%) IT Technician
12 13 (3.74%) Lead
13 12 (3.45%) Product Engineer
13 12 (3.45%) Project Coordinator
13 12 (3.45%) Team Leader
13 12 (3.45%) Verification Engineer
Libraries, Frameworks & Software Standards
1 8 (2.30%) LDAP
1 8 (2.30%) pytest
2 4 (1.15%) DAO
3 3 (0.86%) .NET
3 3 (0.86%) CSS
3 3 (0.86%) HTML
3 3 (0.86%) SAML
4 2 (0.57%) JSON
4 2 (0.57%) XML
5 1 (0.29%) .NET Core
Miscellaneous
1 25 (7.18%) Onboarding
2 21 (6.03%) Driving Licence
3 19 (5.46%) Self-Motivation
4 15 (4.31%) Management Information System
5 8 (2.30%) Smartphone
6 7 (2.01%) Data Protection Act
6 7 (2.01%) NHS
6 7 (2.01%) Product Ownership
7 5 (1.44%) Algorithms
7 5 (1.44%) Client/Server
7 5 (1.44%) Data Structures
7 5 (1.44%) iPhone
8 4 (1.15%) Analogue Electronics
8 4 (1.15%) GNSS
8 4 (1.15%) Replication
8 4 (1.15%) Tandem
9 3 (0.86%) IoT
9 3 (0.86%) Reference Data
10 2 (0.57%) Blog
10 2 (0.57%) Social Media
Operating Systems
1 105 (30.17%) Windows
2 39 (11.21%) Windows 10
3 19 (5.46%) Linux
4 17 (4.89%) Unix
5 16 (4.60%) Mac OS
6 15 (4.31%) Windows Server
7 14 (4.02%) Apple iOS
8 9 (2.59%) Windows 7
9 5 (1.44%) Android
9 5 (1.44%) Windows Server 2019
10 4 (1.15%) Mac OS X
10 4 (1.15%) Windows Server 2012
10 4 (1.15%) Windows Server 2016
11 3 (0.86%) AIX
11 3 (0.86%) Solaris
12 2 (0.57%) Windows 2000
12 2 (0.57%) Windows 8
12 2 (0.57%) Windows XP
13 1 (0.29%) CentOS
Processes & Methodologies
1 99 (28.45%) Problem-Solving
2 75 (21.55%) Customer Service
3 43 (12.36%) Project Management
4 39 (11.21%) ITIL
5 38 (10.92%) Agile
6 33 (9.48%) Continuous Improvement
7 28 (8.05%) Strategic Thinking
8 27 (7.76%) B2B
9 24 (6.90%) Computer Science
10 23 (6.61%) Time Management
11 21 (6.03%) Customer Experience
12 18 (5.17%) Analytical Thinking
12 18 (5.17%) Network Management
12 18 (5.17%) Roadmaps
13 17 (4.89%) CRM
13 17 (4.89%) PRINCE2
13 17 (4.89%) Project Delivery
14 16 (4.60%) ERP
14 16 (4.60%) Service Delivery
15 15 (4.31%) Customer Requirements
Programming Languages
1 34 (9.77%) SQL
2 24 (6.90%) Python
3 23 (6.61%) PowerShell
4 13 (3.74%) JavaScript
5 12 (3.45%) MATLAB
6 10 (2.87%) T-SQL
7 6 (1.72%) Java
7 6 (1.72%) PHP
7 6 (1.72%) R
8 4 (1.15%) C#
9 1 (0.29%) C++
9 1 (0.29%) Shell Script
9 1 (0.29%) VB
9 1 (0.29%) VBA
Qualifications
1 134 (38.51%) Degree
2 41 (11.78%) Security Cleared
3 32 (9.20%) SC Cleared
4 23 (6.61%) Microsoft Certification
5 20 (5.75%) MCP
6 16 (4.60%) DBS Check
7 15 (4.31%) Computer Science Degree
7 15 (4.31%) HND
8 11 (3.16%) A+ Certification
9 7 (2.01%) BPSS Clearance
9 7 (2.01%) ISEB
10 6 (1.72%) Chartered Engineer
10 6 (1.72%) DV Cleared
10 6 (1.72%) HNC
10 6 (1.72%) IIBA
10 6 (1.72%) Master's Degree
11 5 (1.44%) MCITP
11 5 (1.44%) PMI Certification
11 5 (1.44%) PMP
11 5 (1.44%) RHCE
Quality Assurance & Compliance
1 14 (4.02%) SLA
2 10 (2.87%) GDPR
3 7 (2.01%) IEC 61508
3 7 (2.01%) ISO 9001
3 7 (2.01%) ISO/IEC 12207
3 7 (2.01%) QA
4 6 (1.72%) ISO/IEC 15288
4 6 (1.72%) PMO
5 5 (1.44%) Accessibility
6 3 (0.86%) Data Quality
6 3 (0.86%) ISO/IEC 27001
7 1 (0.29%) Disclosure Scotland
7 1 (0.29%) ISO 14001
System Software
1 68 (19.54%) Active Directory
2 8 (2.30%) Hyper-V
2 8 (2.30%) VMware Infrastructure
3 4 (1.15%) XenApp
3 4 (1.15%) XenDesktop
4 3 (0.86%) Firmware
4 3 (0.86%) Forefront TMG
4 3 (0.86%) VMware Workstation
5 1 (0.29%) Virtual Desktop
5 1 (0.29%) Virtual Servers
Systems Management
1 22 (6.32%) SCCM
2 9 (2.59%) Microsoft Intune
3 6 (1.72%) Icinga
4 5 (1.44%) Rancher
5 4 (1.15%) Single Sign-On
6 3 (0.86%) Oracle Statspack
6 3 (0.86%) SCOM
6 3 (0.86%) WSUS
7 1 (0.29%) Backup Exec
7 1 (0.29%) Functional Safety
7 1 (0.29%) Jamf Pro
7 1 (0.29%) Symantec Endpoint Protection
Vendors
1 246 (70.69%) Microsoft
2 12 (3.45%) Citrix
3 9 (2.59%) SolarWinds
4 8 (2.30%) IBM
4 8 (2.30%) McAfee
4 8 (2.30%) MobileIron
4 8 (2.30%) VMware
5 7 (2.01%) Salesforce
6 6 (1.72%) BiZZdesign
6 6 (1.72%) Google
6 6 (1.72%) Oracle
6 6 (1.72%) ServiceNow
7 4 (1.15%) Cognos
7 4 (1.15%) HP
7 4 (1.15%) iManage
8 3 (0.86%) Adobe
8 3 (0.86%) Alteryx
8 3 (0.86%) Dell
8 3 (0.86%) New Relic
8 3 (0.86%) Northgate