Citrix Certified Administrator (CCA)
UK

The table below provides summary statistics for permanent job vacancies with a requirement for CCA qualifications. It includes a benchmarking guide to the salaries offered over the 6 months leading up to 26 July 2024, comparing them to the same period in the previous two years.

6 months to
26 Jul 2024
Same period 2023 Same period 2022
Rank 820 851 1169
Rank change year-on-year +31 +318 -176
Permanent jobs citing CCA 22 36 106
As % of all permanent jobs advertised in the UK 0.024% 0.045% 0.060%
As % of the Qualifications category 0.093% 0.13% 0.22%
Number of salaries quoted 20 21 70
10th Percentile - - £32,500
25th Percentile £30,000 £42,500 £41,250
Median annual salary (50th Percentile) £45,000 £52,500 £60,000
Median % change year-on-year -14.29% -12.50% +150.00%
75th Percentile £52,500 £58,750 £68,938
90th Percentile £82,750 £69,443 £81,250
UK excluding London median annual salary £45,000 £50,000 £47,500
% change year-on-year -10.00% +5.26% +97.92%

All Academic and Professional Certifications
UK

CCA falls under the Academic Qualifications and Professional Certifications category. For comparison with the information above, the following table provides summary statistics for all permanent job vacancies requiring academic qualifications or professional certifications.

Permanent vacancies requiring academic qualifications or professional certifications 23,768 27,219 48,854
As % of all permanent jobs advertised in the UK 26.30% 33.73% 27.87%
Number of salaries quoted 13,396 13,767 20,158
10th Percentile £30,000 £32,000 £30,500
25th Percentile £40,000 £42,500 £40,000
Median annual salary (50th Percentile) £55,000 £60,000 £55,000
Median % change year-on-year -8.33% +9.09% -
75th Percentile £72,425 £76,250 £73,750
90th Percentile £88,500 £95,000 £91,250
UK excluding London median annual salary £50,000 £52,500 £48,500
% change year-on-year -4.76% +8.25% +2.11%

CCA
Job Vacancy Trend

Job postings citing CCA as a proportion of all IT jobs advertised.
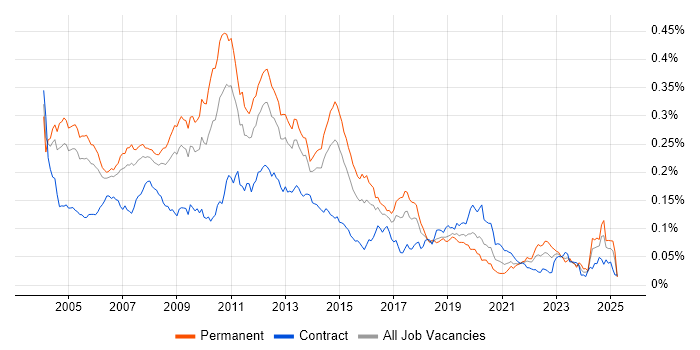
Job vacancy trend for CCA in the UK

CCA
Salary Trend

3-month moving average salary quoted in jobs citing CCA.

Salary trend for CCA in the UK

CCA
Salary Histogram

Salary distribution for jobs citing CCA over the 6 months to 26 July 2024.

Salary histogram for CCA in the UK

CCA
Top 11 Job Locations

The table below looks at the demand and provides a guide to the median salaries quoted in IT jobs citing CCA within the UK over the 6 months to 26 July 2024. The 'Rank Change' column provides an indication of the change in demand within each location based on the same 6 month period last year.

Location Rank Change
on Same Period
Last Year
Matching
Permanent
IT Job Ads
Median Salary
Past 6 Months
Median Salary
% Change
on Same Period
Last Year
Live
Jobs
England +22 22 £45,000 -14.29% 8
UK excluding London -18 19 £45,000 -10.00% 7
Work from Home +47 15 £30,000 -40.00% 2
South West +2 9 £30,000 -42.86% 2
Midlands -16 6 £47,500 -9.03%
East Midlands -24 4 £48,750 +30.00%
London +62 2 £72,500 +41.46% 1
South East +5 2 £47,500 -0.21% 3
West Midlands -2 2 £45,000 -32.77%
North West - 2 £65,000 - 1
North of England - 2 £65,000 - 1

CCA
Co-occurring Skills and Capabilities by Category

The follow tables expand on the table above by listing co-occurrences grouped by category. The same employment type, locality and period is covered with up to 20 co-occurrences shown in each of the following categories:

Application Platforms
1 15 (68.18%) Microsoft Exchange
2 1 (4.55%) IIS
2 1 (4.55%) SharePoint
Applications
1 9 (40.91%) Microsoft Office
Business Applications
1 1 (4.55%) Payment Gateway
1 1 (4.55%) SAP CO
1 1 (4.55%) SAP FI
1 1 (4.55%) SAP FI/CO
1 1 (4.55%) SAP S/4HANA
Cloud Services
1 10 (45.45%) Microsoft 365
2 8 (36.36%) Azure
3 2 (9.09%) AWS
3 2 (9.09%) GCP
4 1 (4.55%) IaaS
4 1 (4.55%) PaaS
4 1 (4.55%) SaaS
Communications & Networking
1 12 (54.55%) Firewall
2 11 (50.00%) SAN
3 8 (36.36%) Remote Desktop
4 3 (13.64%) DHCP
4 3 (13.64%) DNS
5 2 (9.09%) NetScaler
6 1 (4.55%) ISDN
6 1 (4.55%) NAS
6 1 (4.55%) TCP/IP
6 1 (4.55%) VLAN
6 1 (4.55%) VoIP
6 1 (4.55%) WAAS
Database & Business Intelligence
1 1 (4.55%) SAP HANA
1 1 (4.55%) SQL Server
1 1 (4.55%) SQL Server Reporting Services
General
1 4 (18.18%) Finance
2 3 (13.64%) Law
3 2 (9.09%) Mandarin Language
3 2 (9.09%) Social Skills
4 1 (4.55%) Analytical Skills
4 1 (4.55%) Documentation Skills
4 1 (4.55%) Marketing
4 1 (4.55%) Organisational Skills
Job Titles
1 7 (31.82%) Analyst
2 5 (22.73%) Service Analyst
2 5 (22.73%) Service Desk Analyst
2 5 (22.73%) Technical Analyst
2 5 (22.73%) Technical Services Analyst
3 4 (18.18%) 3rd Line Engineer
4 3 (13.64%) IT Engineer
4 3 (13.64%) Service Desk Engineer
5 2 (9.09%) Infrastructure Engineer
5 2 (9.09%) Virtualisation Engineer
6 1 (4.55%) 3rd Line Support
6 1 (4.55%) 3rd Line Support Analyst
6 1 (4.55%) Consultant
6 1 (4.55%) Project Analyst
6 1 (4.55%) SAP CO Consultant
6 1 (4.55%) SAP Consultant
6 1 (4.55%) SAP FI Consultant
6 1 (4.55%) SAP FI/CO Consultant
6 1 (4.55%) Security Specialist
6 1 (4.55%) Support Analyst
Miscellaneous
1 8 (36.36%) Driving Licence
1 8 (36.36%) Replication
2 1 (4.55%) FMCG
2 1 (4.55%) Management Information System
Operating Systems
1 15 (68.18%) Windows
2 8 (36.36%) Android
2 8 (36.36%) Apple iOS
3 6 (27.27%) Windows Server
4 1 (4.55%) Windows Server 2016
4 1 (4.55%) Windows Server 2019
Processes & Methodologies
1 10 (45.45%) ITIL
2 8 (36.36%) Customer Service
2 8 (36.36%) Remote Monitoring and Management
2 8 (36.36%) Ticket Management
3 3 (13.64%) Infrastructure Engineering
4 2 (9.09%) Application Packaging
4 2 (9.09%) Cloud Security
4 2 (9.09%) Cybersecurity
4 2 (9.09%) Data Protection
4 2 (9.09%) Disaster Recovery
4 2 (9.09%) Fintech
4 2 (9.09%) Incident Response
4 2 (9.09%) Personalization
4 2 (9.09%) Problem Management
4 2 (9.09%) Problem-Solving
4 2 (9.09%) Root Cause Analysis
4 2 (9.09%) Task Automation
4 2 (9.09%) TOGAF
5 1 (4.55%) Analytics
5 1 (4.55%) Computer Science
Programming Languages
1 12 (54.55%) PowerShell
2 2 (9.09%) SQL
3 1 (4.55%) ABAP
3 1 (4.55%) Java
3 1 (4.55%) Python
Qualifications
1 18 (81.82%) Citrix Certification
2 8 (36.36%) MCP
3 7 (31.82%) Cisco Certification
3 7 (31.82%) Degree
4 5 (22.73%) CCNA
4 5 (22.73%) VMware Certified Professional (VCP)
5 4 (18.18%) CCDA
5 4 (18.18%) Microsoft Certification
6 2 (9.09%) (ISC)2 CCSP
6 2 (9.09%) CISSP
6 2 (9.09%) MCSA
7 1 (4.55%) AWS Certification
7 1 (4.55%) CCSP
7 1 (4.55%) Computer Science Degree
7 1 (4.55%) HP AIS
7 1 (4.55%) JNCIA
7 1 (4.55%) Master's Degree
7 1 (4.55%) MCSE
7 1 (4.55%) SC Cleared
7 1 (4.55%) Security Cleared
Quality Assurance & Compliance
1 3 (13.64%) ISO/IEC 27001
2 2 (9.09%) PCI DSS
2 2 (9.09%) SOC 2
3 1 (4.55%) GDPR
3 1 (4.55%) IFRS
3 1 (4.55%) NCSC
3 1 (4.55%) QA
System Software
1 15 (68.18%) Active Directory
1 15 (68.18%) VMware Infrastructure
2 11 (50.00%) Hyper-V
3 9 (40.91%) XenApp
4 8 (36.36%) XenDesktop
5 4 (18.18%) vSphere
6 2 (9.09%) Citrix Hypervisor
6 2 (9.09%) Microsoft App-V
7 1 (4.55%) Microsoft Virtual Server
7 1 (4.55%) Terminal Services
7 1 (4.55%) Virtual Desktop
7 1 (4.55%) Virtual Servers
7 1 (4.55%) VMware ESXi
Systems Management
1 8 (36.36%) Backup Exec
1 8 (36.36%) Symantec Endpoint Protection
2 2 (9.09%) SysTrack
3 1 (4.55%) vCenter Server
Vendors
1 17 (77.27%) Microsoft
2 16 (72.73%) VMware
3 14 (63.64%) Citrix
4 9 (40.91%) Dell
4 9 (40.91%) Veeam
5 8 (36.36%) Fortinet
5 8 (36.36%) N-able
5 8 (36.36%) Symantec
5 8 (36.36%) Veritas
6 2 (9.09%) Ivanti
6 2 (9.09%) Splunk
7 1 (4.55%) Cisco
7 1 (4.55%) HP
7 1 (4.55%) Meraki
7 1 (4.55%) NetApp
7 1 (4.55%) SAP