User Story
UK

The following table provides summary statistics for permanent job vacancies with a requirement for User Stories skills. Included is a benchmarking guide to the salaries offered in vacancies that have cited User Stories over the 6 months to 28 November 2023 with a comparison to the same period in the previous 2 years.

6 months to
28 Nov 2023
Same period 2022 Same period 2021
Rank 216 114 137
Rank change year-on-year -102 +23 +58
Permanent jobs citing User Stories 887 3,844 3,495
As % of all permanent jobs advertised in the UK 1.63% 3.06% 2.72%
As % of the Processes & Methodologies category 1.74% 3.20% 2.85%
Number of salaries quoted 705 1,955 2,132
10th Percentile £41,250 £39,000 £37,500
25th Percentile £48,750 £48,500 £45,000
Median annual salary (50th Percentile) £60,000 £61,180 £55,000
Median % change year-on-year -1.93% +11.24% -4.35%
75th Percentile £72,500 £75,000 £69,250
90th Percentile £88,250 £86,250 £82,500
UK excluding London median annual salary £53,375 £55,000 £50,000
% change year-on-year -2.95% +10.00% -

All Process and Methodology Skills
UK

User Stories is in the Processes and Methodologies category. The following table is for comparison with the above and provides summary statistics for all permanent job vacancies with a requirement for process or methodology skills.

Permanent vacancies with a requirement for process or methodology skills 51,121 120,104 122,523
As % of all permanent jobs advertised in the UK 94.09% 95.72% 95.43%
Number of salaries quoted 36,956 73,203 81,032
10th Percentile £32,500 £34,313 £32,500
25th Percentile £43,750 £45,000 £42,500
Median annual salary (50th Percentile) £60,000 £60,000 £59,000
Median % change year-on-year - +1.69% +7.27%
75th Percentile £80,000 £81,250 £77,500
90th Percentile £98,750 £100,000 £95,000
UK excluding London median annual salary £52,500 £53,000 £50,000
% change year-on-year -0.94% +6.00% +4.17%

User Stories
Job Vacancy Trend

Job postings citing User Stories as a proportion of all IT jobs advertised.
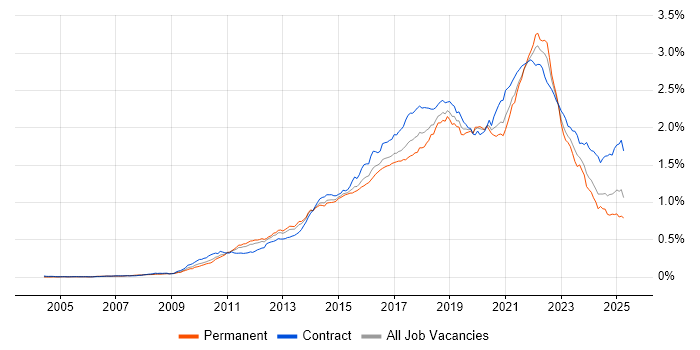
Job vacancy trend for User Stories in the UK

User Stories
Salary Trend

3-month moving average salary quoted in jobs citing User Stories.

Salary trend for User Stories in the UK

User Stories
Salary Histogram

Salary distribution for jobs citing User Stories over the 6 months to 28 November 2023.

Salary histogram for User Stories in the UK

User Stories
Top 17 Job Locations

The table below looks at the demand and provides a guide to the median salaries quoted in IT jobs citing User Stories within the UK over the 6 months to 28 November 2023. The 'Rank Change' column provides an indication of the change in demand within each location based on the same 6 month period last year.

Location Rank Change
on Same Period
Last Year
Matching
Permanent
IT Job Ads
Median Salary
Past 6 Months
Median Salary
% Change
on Same Period
Last Year
Live
Jobs
England -91 795 £60,000 -4.00% 288
UK excluding London -120 432 £53,375 -2.95% 184
London -38 406 £65,000 -3.70% 136
Work from Home -111 401 £60,000 - 165
Midlands -56 111 £55,000 - 26
South East -43 97 £50,000 -13.04% 50
North of England -119 96 £55,000 - 44
West Midlands -43 71 £65,000 +20.68% 22
South West -62 50 £50,000 -1.96% 30
North West -100 47 £55,000 +2.98% 23
Yorkshire -39 44 £54,000 -1.82% 15
East Midlands -33 37 £52,500 -4.55% 4
Wales +15 33 £46,816 +4.03% 9
Scotland -39 24 £55,000 +10.00% 13
East of England +40 17 £52,500 -17.65% 9
North East +21 5 £76,250 +52.50% 6
Northern Ireland +4 4 - - 5

User Stories
Co-occurring Skills and Capabilities by Category

The follow tables expand on the table above by listing co-occurrences grouped by category. The same employment type, locality and period is covered with up to 20 co-occurrences shown in each of the following categories:

Application Platforms
1 42 (4.74%) Confluence
2 28 (3.16%) CMS
3 16 (1.80%) SharePoint
4 7 (0.79%) Umbraco
5 6 (0.68%) IIS
5 6 (0.68%) Kentico
5 6 (0.68%) Mendix
6 4 (0.45%) Sitecore CMS
7 3 (0.34%) Drupal
7 3 (0.34%) EPiServer
7 3 (0.34%) JBoss
8 2 (0.23%) Adobe Experience Manager
8 2 (0.23%) DNN
8 2 (0.23%) Headless CMS
8 2 (0.23%) MS Exchange
9 1 (0.11%) Cloud Foundry
9 1 (0.11%) Moodle
9 1 (0.11%) Oracle SOA Suite
9 1 (0.11%) WebSphere
9 1 (0.11%) WebSphere Application Server
Applications
1 31 (3.49%) MS Visio
2 21 (2.37%) Microsoft Office
3 19 (2.14%) Microsoft Excel
4 13 (1.47%) Microsoft PowerPoint
5 6 (0.68%) Adobe XD
6 5 (0.56%) Microsoft Project
7 4 (0.45%) Adobe Illustrator
7 4 (0.45%) Photoshop
8 3 (0.34%) Trello
9 2 (0.23%) InVision
9 2 (0.23%) Sketch
10 1 (0.11%) Siemens NX
Business Applications
1 18 (2.03%) Dynamics CRM
2 8 (0.90%) Distributed Ledger
3 6 (0.68%) Oracle Financials
3 6 (0.68%) Salesforce CRM
4 4 (0.45%) Magento
4 4 (0.45%) Oracle Receivables
5 3 (0.34%) Oracle ERP
5 3 (0.34%) Teamcenter
6 2 (0.23%) Dynamics AX
6 2 (0.23%) Endur
6 2 (0.23%) OpenLink RightAngle
6 2 (0.23%) Oracle Applications
6 2 (0.23%) Oracle FAH
6 2 (0.23%) SAP Hybris
6 2 (0.23%) Temenos T24
7 1 (0.11%) Oracle EBS R12
7 1 (0.11%) Oracle iSupplier
7 1 (0.11%) Oracle SCM
7 1 (0.11%) Shopify
7 1 (0.11%) thinkFolio
Cloud Services
1 179 (20.18%) Azure
2 101 (11.39%) AWS
3 80 (9.02%) Azure DevOps
4 66 (7.44%) Power Platform
5 46 (5.19%) SaaS
6 39 (4.40%) Dynamics 365
7 38 (4.28%) Serverless
8 33 (3.72%) PowerApps
9 31 (3.49%) Microsoft 365
10 29 (3.27%) GitHub
11 22 (2.48%) GCP
12 14 (1.58%) Power Automate
13 11 (1.24%) AWS Lambda
13 11 (1.24%) Azure Functions
13 11 (1.24%) Figma
14 9 (1.01%) Google Analytics
15 8 (0.90%) Azure Cosmos DB
15 8 (0.90%) Azure Logic Apps
15 8 (0.90%) dbt
15 8 (0.90%) PaaS
Communications & Networking
1 5 (0.56%) Structured Cabling
2 4 (0.45%) WebEx
3 1 (0.11%) 3G
3 1 (0.11%) DSL
3 1 (0.11%) HTTP
3 1 (0.11%) Internet
3 1 (0.11%) PPP
3 1 (0.11%) SSL
3 1 (0.11%) VPN
Database & Business Intelligence
1 71 (8.00%) SQL Server
2 56 (6.31%) Power BI
3 50 (5.64%) Relational Database
4 33 (3.72%) NoSQL
5 13 (1.47%) Big Data
5 13 (1.47%) Tableau
6 9 (1.01%) Data Mining
6 9 (1.01%) PostgreSQL
7 8 (0.90%) Data Hub
7 8 (0.90%) DynamoDB
7 8 (0.90%) RDBMS
8 7 (0.79%) Amazon Redshift
8 7 (0.79%) Data Warehouse
9 6 (0.68%) Data Lake
9 6 (0.68%) MySQL
9 6 (0.68%) SQL Server Integration Services
9 6 (0.68%) SQL Server Reporting Services
10 4 (0.45%) MongoDB
10 4 (0.45%) Redis
11 3 (0.34%) BusinessObjects
Development Applications
1 100 (11.27%) JIRA
2 53 (5.98%) Git
3 31 (3.49%) Jasmine
4 26 (2.93%) Eclipse
4 26 (2.93%) IntelliJ
4 26 (2.93%) Mockito
5 22 (2.48%) Team Foundation Server
6 21 (2.37%) GitLab
7 16 (1.80%) Visual Studio Team System
8 12 (1.35%) git-flow
8 12 (1.35%) Jenkins
9 11 (1.24%) JUnit
9 11 (1.24%) Selenium
9 11 (1.24%) Xcode
10 10 (1.13%) Protractor
11 8 (0.90%) Artifactory
12 7 (0.79%) Android Studio
12 7 (0.79%) Gradle
12 7 (0.79%) Karma Test Runner
12 7 (0.79%) Moq
General
1 232 (26.16%) Social Skills
2 186 (20.97%) Finance
3 130 (14.66%) Analytical Skills
4 59 (6.65%) Retail
5 54 (6.09%) Marketing
6 53 (5.98%) Public Sector
7 51 (5.75%) Inclusion and Diversity
8 44 (4.96%) Legal
9 31 (3.49%) Law
10 30 (3.38%) Influencing Skills
11 29 (3.27%) Banking
12 27 (3.04%) Presentation Skills
13 23 (2.59%) Automotive
14 22 (2.48%) Organisational Skills
15 19 (2.14%) Manufacturing
16 18 (2.03%) Pharmaceutical
17 17 (1.92%) Digital Healthcare
18 15 (1.69%) Telecoms
19 9 (1.01%) Back Office
19 9 (1.01%) Publishing
Job Titles
1 294 (33.15%) Analyst
2 260 (29.31%) Business Analyst
3 184 (20.74%) Developer
4 137 (15.45%) Product Owner
5 119 (13.42%) Senior
6 57 (6.43%) Product Manager
7 55 (6.20%) Full Stack Developer
8 44 (4.96%) Lead
9 35 (3.95%) Consultant
10 34 (3.83%) Technical Analyst
11 33 (3.72%) Java Developer
11 33 (3.72%) Senior Analyst
12 30 (3.38%) Technical Business Analyst
13 29 (3.27%) Senior Developer
14 28 (3.16%) Senior Business Analyst
15 26 (2.93%) Digital Product Owner
16 24 (2.71%) Senior DevOps
17 23 (2.59%) C# Developer
18 22 (2.48%) Project Analyst
19 21 (2.37%) Project Manager
Libraries, Frameworks & Software Standards
1 84 (9.47%) .NET
2 82 (9.24%) AngularJS
3 78 (8.79%) CSS
4 73 (8.23%) HTML
5 55 (6.20%) React
6 45 (5.07%) .NET Framework
7 43 (4.85%) JSON
8 37 (4.17%) ASP.NET
9 34 (3.83%) .NET Core
10 33 (3.72%) jQuery
11 29 (3.27%) Spring
12 27 (3.04%) XML
13 26 (2.93%) ASP.NET MVC
13 26 (2.93%) Kafka
13 26 (2.93%) RabbitMQ
14 25 (2.82%) REST
15 24 (2.71%) Vue
16 23 (2.59%) Spring Boot
17 22 (2.48%) Web Services
18 20 (2.25%) Node.js
Miscellaneous
1 276 (31.12%) Product Ownership
2 45 (5.07%) Management Information System
3 28 (3.16%) Self-Motivation
4 26 (2.93%) Enterprise Software
5 20 (2.25%) Low-Code
5 20 (2.25%) Virtual Team
6 18 (2.03%) Data Structures
7 17 (1.92%) Onboarding
8 14 (1.58%) Cloud Native
9 11 (1.24%) Graphic Design
9 11 (1.24%) Reference Data
10 9 (1.01%) 3D Graphics
10 9 (1.01%) FMCG
10 9 (1.01%) Life Science
10 9 (1.01%) Mobile App
10 9 (1.01%) Photography
11 8 (0.90%) Blockchain
11 8 (0.90%) Enterprise Cloud
11 8 (0.90%) Public Cloud
12 7 (0.79%) Reinsurance
Operating Systems
1 20 (2.25%) Linux
2 14 (1.58%) Apple iOS
3 10 (1.13%) Android
3 10 (1.13%) Unix
4 8 (0.90%) Windows
5 7 (0.79%) Windows Server
6 5 (0.56%) Windows 10
6 5 (0.56%) Windows Server 2012
6 5 (0.56%) Windows Server 2019
7 1 (0.11%) CentOS
7 1 (0.11%) Embedded Linux
7 1 (0.11%) Fedora
7 1 (0.11%) Red Hat Enterprise Linux
7 1 (0.11%) Ubuntu
7 1 (0.11%) VMS
Processes & Methodologies
1 577 (65.05%) Agile
2 253 (28.52%) Scrum
3 226 (25.48%) Roadmaps
4 222 (25.03%) Acceptance Criteria
5 207 (23.34%) Product Backlog
6 167 (18.83%) DevOps
7 158 (17.81%) Problem-Solving
8 142 (16.01%) Epics
8 142 (16.01%) Product Roadmap
9 140 (15.78%) User Experience
10 122 (13.75%) Business Analysis
10 122 (13.75%) Project Management
11 107 (12.06%) Requirements Gathering
12 104 (11.72%) Analytics
13 101 (11.39%) Mentoring
14 100 (11.27%) CRM
15 98 (11.05%) User Acceptance Testing
16 97 (10.94%) Backlog Management
17 96 (10.82%) Backlog Prioritisation
18 93 (10.48%) Stakeholder Management
Programming Languages
1 175 (19.73%) SQL
2 142 (16.01%) JavaScript
3 96 (10.82%) Java
4 91 (10.26%) C#
5 46 (5.19%) Python
6 45 (5.07%) TypeScript
7 21 (2.37%) T-SQL
8 13 (1.47%) Kotlin
9 11 (1.24%) Objective-C
9 11 (1.24%) Swift
10 10 (1.13%) R
11 8 (0.90%) Bash
11 8 (0.90%) PowerShell
12 7 (0.79%) Apex Code
12 7 (0.79%) Bicep
13 5 (0.56%) Shell Script
14 4 (0.45%) VBA
15 3 (0.34%) Go
15 3 (0.34%) Perl
16 2 (0.23%) Data Analysis Expressions
Qualifications
1 126 (14.21%) Degree
2 67 (7.55%) Security Cleared
3 43 (4.85%) Computer Science Degree
4 42 (4.74%) SC Cleared
5 24 (2.71%) Microsoft Certification
6 23 (2.59%) BPSS Clearance
7 19 (2.14%) DBS Check
8 16 (1.80%) Master's Degree
9 12 (1.35%) ISTQB
10 10 (1.13%) AWS Certification
11 9 (1.01%) IIBA
12 7 (0.79%) AWS Certified DevOps Engineer
12 7 (0.79%) AWS Certified SysOps Administrator
12 7 (0.79%) Azure Certification
12 7 (0.79%) CSPO
12 7 (0.79%) PMI Certification
13 6 (0.68%) ISEB
14 5 (0.56%) DV Cleared
14 5 (0.56%) ITIL Foundation Certificate
14 5 (0.56%) SAFe Agilist
Quality Assurance & Compliance
1 80 (9.02%) QA
2 17 (1.92%) Accessibility
3 14 (1.58%) PMO
4 9 (1.01%) Data Quality
5 6 (0.68%) GAAP
5 6 (0.68%) GDPR
6 4 (0.45%) Actionable Recommendations
7 3 (0.34%) GRC
7 3 (0.34%) ISO/IEC 27001
7 3 (0.34%) NIST
7 3 (0.34%) NIST 800
7 3 (0.34%) PCI DSS
8 2 (0.23%) EMIR
8 2 (0.23%) MiFID
8 2 (0.23%) SLA
8 2 (0.23%) WCAG
9 1 (0.11%) GxP
9 1 (0.11%) Sarbanes-Oxley
System Software
1 55 (6.20%) Docker
2 13 (1.47%) Active Directory
3 5 (0.56%) vSphere
4 3 (0.34%) IAG
5 1 (0.11%) NFS
5 1 (0.11%) Samba
Systems Management
1 45 (5.07%) Kubernetes
2 16 (1.80%) Terraform
3 14 (1.58%) Ansible
4 10 (1.13%) Puppet
5 8 (0.90%) Packer
6 7 (0.79%) Argo
6 7 (0.79%) Single Sign-On
7 5 (0.56%) Nessus
7 5 (0.56%) SELinux
8 1 (0.11%) Consul
8 1 (0.11%) Grafana
8 1 (0.11%) HP ALM
8 1 (0.11%) HP Quality Center
8 1 (0.11%) Nagios
8 1 (0.11%) OpenNMS
8 1 (0.11%) Progress Chef
8 1 (0.11%) ZABBIX
Vendors
1 117 (13.19%) Microsoft
2 59 (6.65%) Salesforce
3 32 (3.61%) Google
4 21 (2.37%) IBM
5 14 (1.58%) Atlassian
6 12 (1.35%) Oracle
7 11 (1.24%) ServiceNow
8 10 (1.13%) MuleSoft
9 9 (1.01%) Confluent
10 8 (0.90%) JD Edwards
10 8 (0.90%) Splunk
11 7 (0.79%) SAP
12 5 (0.56%) Adobe
12 5 (0.56%) Alteryx
12 5 (0.56%) arcserve
12 5 (0.56%) Databricks
12 5 (0.56%) McAfee
12 5 (0.56%) Sophos
12 5 (0.56%) VMware
13 4 (0.45%) Mercator