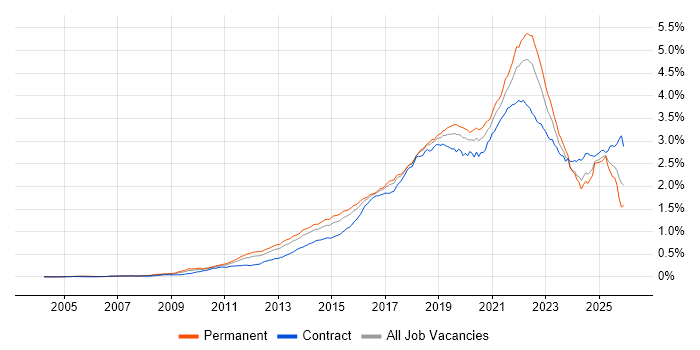
Product Ownership Jobs

Product Ownership
UK

The table below looks at the prevalence of the term Product Ownership in permanent job vacancies. Included is a benchmarking guide to the salaries offered in vacancies that cited Product Ownership over the 6 months leading up to 15 June 2025, comparing them to the same period in the previous two years.

6 months to
15 Jun 2025
Same period 2024 Same period 2023
Rank 111 145 89
Rank change year-on-year +34 -56 -27
Permanent jobs citing Product Ownership 1,525 2,097 3,402
As % of all permanent jobs advertised in the UK 2.72% 1.90% 3.71%
As % of the Miscellaneous category 7.25% 5.65% 8.48%
Number of salaries quoted 654 1,379 2,198
10th Percentile £47,231 £42,000 £44,693
25th Percentile £56,176 £48,750 £51,250
Median annual salary (50th Percentile) £67,500 £62,500 £65,000
Median % change year-on-year +8.00% -3.85% +4.00%
75th Percentile £83,750 £80,000 £83,750
90th Percentile £103,375 £95,000 £100,000
UK excluding London median annual salary £65,000 £57,500 £60,000
% change year-on-year +13.04% -4.17% +8.11%

All Generic Skills
UK

Product Ownership falls under the General and Transferable Skills category. For comparison with the information above, the following table provides summary statistics for all permanent job vacancies requiring generic IT skills.

Permanent vacancies with a requirement for generic IT skills 21,037 37,087 40,121
As % of all permanent jobs advertised in the UK 37.54% 33.57% 43.71%
Number of salaries quoted 9,736 23,540 22,034
10th Percentile £30,000 £28,250 £35,750
25th Percentile £41,250 £38,605 £46,454
Median annual salary (50th Percentile) £60,000 £55,000 £65,000
Median % change year-on-year +9.09% -15.38% +4.00%
75th Percentile £78,750 £75,000 £85,000
90th Percentile £107,500 £97,500 £110,000
UK excluding London median annual salary £53,500 £50,000 £55,000
% change year-on-year +7.00% -9.09% +4.76%

Product Ownership
Job Vacancy Trend

Job postings citing Product Ownership as a proportion of all IT jobs advertised.

Job vacancy trend for Product Ownership in the UK

Product Ownership
Salary Trend

3-month moving average salary quoted in jobs citing Product Ownership.

Salary trend for Product Ownership in the UK

Product Ownership
Salary Histogram

Salary distribution for jobs citing Product Ownership over the 6 months to 15 June 2025.

Salary histogram for Product Ownership in the UK

Product Ownership
Top 17 Job Locations

The table below looks at the demand and provides a guide to the median salaries quoted in IT jobs citing Product Ownership within the UK over the 6 months to 15 June 2025. The 'Rank Change' column provides an indication of the change in demand within each location based on the same 6 month period last year.

Location Rank Change
on Same Period
Last Year
Matching
Permanent
IT Job Ads
Median Salary
Past 6 Months
Median Salary
% Change
on Same Period
Last Year
Live
Jobs
England +39 1,354 £67,500 +8.00% 1,775
UK excluding London +40 961 £65,000 +13.04% 1,227
Work from Home +36 810 £71,500 +19.17% 1,080
London +14 453 £75,000 -6.25% 912
North of England +63 389 £62,500 +7.82% 294
North West +49 286 £57,560 +0.10% 176
South East +17 193 £65,000 +1.56% 490
Midlands +8 132 £62,500 +9.65% 140
Scotland +45 117 £71,500 +30.00% 94
Yorkshire +51 94 £71,991 +19.99% 94
West Midlands -3 78 £57,500 - 95
East of England +39 60 £62,500 +26.26% 67
South West +3 59 £63,750 +10.87% 86
East Midlands +57 54 £70,000 +41.41% 37
North East +26 9 £50,000 -13.74% 26
Wales +21 8 £59,857 +14.01% 35
Northern Ireland +36 4 - - 29

Product Ownership
Co-occurring Skills and Capabilities by Category

The follow tables expand on the table above by listing co-occurrences grouped by category. The same employment type, locality and period is covered with up to 20 co-occurrences shown in each of the following categories:

Application Platforms
1 276 (18.10%) Confluence
2 27 (1.77%) SharePoint
3 18 (1.18%) CMS
4 17 (1.11%) Apache Spark
5 9 (0.59%) Apache Airflow
6 7 (0.46%) Microsoft Exchange
7 5 (0.33%) Apache
7 5 (0.33%) Sitecore CMS
8 4 (0.26%) Kentico
8 4 (0.26%) SAS
9 2 (0.13%) CICS
9 2 (0.13%) Umbraco
10 1 (0.066%) Adobe Experience Manager
10 1 (0.066%) Drupal
10 1 (0.066%) nginx
10 1 (0.066%) Oracle Workflow
10 1 (0.066%) ThingWorx
10 1 (0.066%) WebSphere
10 1 (0.066%) WordPress
Applications
1 102 (6.69%) Microsoft Office
2 24 (1.57%) Microsoft Excel
3 15 (0.98%) MS Visio
4 12 (0.79%) Microsoft PowerPoint
4 12 (0.79%) Trello
5 10 (0.66%) Adobe XD
6 3 (0.20%) Chatbot
6 3 (0.20%) Microsoft Project
6 3 (0.20%) UserZoom
7 2 (0.13%) Photoshop
Business Applications
1 65 (4.26%) Sparx Enterprise Architect
1 65 (4.26%) Teamcenter
2 23 (1.51%) Dynamics CRM
3 9 (0.59%) Salesforce CRM
4 5 (0.33%) Payment Gateway
5 4 (0.26%) IBM Planning Analytics
6 2 (0.13%) NetSuite
6 2 (0.13%) Siebel CRM
7 1 (0.066%) Adobe Campaign
7 1 (0.066%) Carpe Diem
7 1 (0.066%) Elite 3E
7 1 (0.066%) Oracle EBS R12
7 1 (0.066%) Oracle General Ledger
7 1 (0.066%) Oracle iProcurement
7 1 (0.066%) Oracle Payables
7 1 (0.066%) Oracle Procure-to-Pay
7 1 (0.066%) Remedy ITSM
7 1 (0.066%) Sage 200
7 1 (0.066%) SAP ERP
7 1 (0.066%) SAP S/4HANA
Cloud Services
1 482 (31.61%) Azure
2 393 (25.77%) AWS
3 237 (15.54%) GCP
4 97 (6.36%) Miro
5 87 (5.70%) SaaS
6 78 (5.11%) Power Platform
7 73 (4.79%) Asana
8 46 (3.02%) Azure DevOps
9 38 (2.49%) GitHub
10 37 (2.43%) Figma
11 33 (2.16%) Dynamics 365
12 32 (2.10%) Serverless
13 24 (1.57%) Azure Synapse Analytics
13 24 (1.57%) Microsoft 365
13 24 (1.57%) PowerApps
14 22 (1.44%) Google Analytics
15 21 (1.38%) Azure Data Factory
15 21 (1.38%) Cloud Computing
15 21 (1.38%) Entra ID
16 16 (1.05%) Azure Logic Apps
Communications & Networking
1 151 (9.90%) Broadband
2 16 (1.05%) HTTP
3 10 (0.66%) TCP/IP
4 9 (0.59%) Firewall
4 9 (0.59%) Internet
5 7 (0.46%) Modbus
6 6 (0.39%) Intranet
7 5 (0.33%) DNS
7 5 (0.33%) SD-WAN
7 5 (0.33%) WAN
8 4 (0.26%) Network Security
9 3 (0.20%) SSL
10 2 (0.13%) BGP
10 2 (0.13%) VPN
11 1 (0.066%) RTP
11 1 (0.066%) Unified Communications
11 1 (0.066%) Value-Added Service
Database & Business Intelligence
1 294 (19.28%) SQL Server
2 63 (4.13%) Power BI
3 43 (2.82%) NoSQL
4 35 (2.30%) Data Lake
5 33 (2.16%) Data Warehouse
6 32 (2.10%) Relational Database
7 24 (1.57%) MySQL
8 23 (1.51%) Azure SQL Database
9 21 (1.38%) MongoDB
10 20 (1.31%) Big Data
10 20 (1.31%) PostgreSQL
11 16 (1.05%) BigQuery
12 15 (0.98%) Tableau
13 14 (0.92%) Metadata
14 11 (0.72%) Amazon Redshift
14 11 (0.72%) Hadoop
15 10 (0.66%) Amazon Athena
16 9 (0.59%) RDBMS
17 8 (0.52%) Apache Iceberg
17 8 (0.52%) Power Query
Development Applications
1 447 (29.31%) JIRA
2 260 (17.05%) Cucumber
3 258 (16.92%) GitLab
4 257 (16.85%) Maven
5 256 (16.79%) Selenium
6 252 (16.52%) Sonatype Nexus
7 250 (16.39%) Bitbucket
8 249 (16.33%) SonarQube
9 65 (4.26%) Rational DOORS
10 41 (2.69%) Git
11 22 (1.44%) Jenkins
12 14 (0.92%) Balsamiq
13 13 (0.85%) Cypress.io
14 12 (0.79%) Axure RP
15 9 (0.59%) Oracle Forms
15 9 (0.59%) Postman
16 8 (0.52%) PowerBuilder
16 8 (0.52%) webpack
17 7 (0.46%) Visual Studio
18 6 (0.39%) MSTest
General
1 706 (46.30%) Finance
2 455 (29.84%) Social Skills
3 402 (26.36%) Banking
4 332 (21.77%) Inclusion and Diversity
5 151 (9.90%) Law
6 150 (9.84%) Analytical Skills
7 141 (9.25%) Retail
8 121 (7.93%) Marketing
9 119 (7.80%) Influencing Skills
10 97 (6.36%) Investment Banking
11 90 (5.90%) Corporate Banking
12 86 (5.64%) Games
13 42 (2.75%) Advertising
14 39 (2.56%) Presentation Skills
15 33 (2.16%) Legal
16 31 (2.03%) Organisational Skills
17 29 (1.90%) Financial Institution
18 28 (1.84%) Public Sector
19 20 (1.31%) Documentation Skills
19 20 (1.31%) Front Office
Job Titles
1 327 (21.44%) Software Engineer
2 219 (14.36%) Lead
3 210 (13.77%) Senior
4 179 (11.74%) Product Owner
5 159 (10.43%) Analyst
6 116 (7.61%) Developer
7 100 (6.56%) Engineering Manager
8 92 (6.03%) Senior Manager
9 82 (5.38%) Product Analyst
10 79 (5.18%) Senior Service Manager
10 79 (5.18%) ServiceNow Manager
11 68 (4.46%) Architect
12 67 (4.39%) Platform Engineer
12 67 (4.39%) Systems Engineer
13 63 (4.13%) Product Manager
14 45 (2.95%) Solutions Architect
15 42 (2.75%) Lead Software Engineer
16 41 (2.69%) Business Analyst
17 34 (2.23%) Account Manager
17 34 (2.23%) Strategic Account Manager
Libraries, Frameworks & Software Standards
1 347 (22.75%) React
2 302 (19.80%) Kafka
3 290 (19.02%) CSS
4 285 (18.69%) HTML
5 272 (17.84%) Spring
6 268 (17.57%) Spring Boot
7 253 (16.59%) Redux
8 247 (16.20%) JPA
9 166 (10.89%) Hibernate
10 150 (9.84%) REST
11 124 (8.13%) RESTful
12 104 (6.82%) Jest
13 90 (5.90%) CSS3
13 90 (5.90%) HTML5
13 90 (5.90%) Sass
14 72 (4.72%) .NET
15 42 (2.75%) AngularJS
16 33 (2.16%) Node.js
17 22 (1.44%) JSON
18 19 (1.25%) GraphQL
Miscellaneous
1 252 (16.52%) Enterprise Software
2 151 (9.90%) Video\Live Streaming
3 100 (6.56%) Management Information System
4 82 (5.38%) Self-Motivation
5 72 (4.72%) Over-the-Top Content
6 63 (4.13%) Cloud Native
7 54 (3.54%) FMCG
8 40 (2.62%) Marketing Technology
9 37 (2.43%) Distributed Systems
10 34 (2.23%) Digital Media
10 34 (2.23%) Public Cloud
11 29 (1.90%) Mobile App
12 23 (1.51%) PMI
13 19 (1.25%) Data Structures
13 19 (1.25%) Private Cloud
14 18 (1.18%) Virtual Team
15 16 (1.05%) Reinsurance
16 15 (0.98%) Fixed Income
17 14 (0.92%) Onboarding
18 10 (0.66%) Algorithms
Operating Systems
1 30 (1.97%) Android
2 27 (1.77%) Linux
3 21 (1.38%) Apple iOS
3 21 (1.38%) Windows
4 13 (0.85%) Unix
5 8 (0.52%) Embedded Linux
6 7 (0.46%) Red Hat Enterprise Linux
7 4 (0.26%) Windows Server
8 2 (0.13%) Windows 10
9 1 (0.066%) VMS
Processes & Methodologies
1 1,032 (67.67%) Agile
2 530 (34.75%) Roadmaps
3 494 (32.39%) Software Engineering
4 483 (31.67%) DevOps
5 430 (28.20%) CI/CD
6 379 (24.85%) Microservices
7 376 (24.66%) Continuous Improvement
8 345 (22.62%) SDLC
9 317 (20.79%) Test Automation
10 308 (20.20%) Containerisation
11 288 (18.89%) Full-Stack Development
12 269 (17.64%) Front End Development
13 264 (17.31%) Stakeholder Management
14 254 (16.66%) Mentoring
15 253 (16.59%) Performance Optimisation
16 235 (15.41%) User Experience
17 229 (15.02%) TDD
18 224 (14.69%) Scrum
19 209 (13.70%) Product Management
20 204 (13.38%) Analytics
Programming Languages
1 405 (26.56%) SQL
2 373 (24.46%) JavaScript
3 340 (22.30%) Java
4 160 (10.49%) TypeScript
5 95 (6.23%) Python
6 89 (5.84%) C#
7 16 (1.05%) Kotlin
8 15 (0.98%) PowerShell
9 10 (0.66%) Apex Code
9 10 (0.66%) C
9 10 (0.66%) PHP
9 10 (0.66%) R
10 9 (0.59%) C++
11 8 (0.52%) PL/SQL
11 8 (0.52%) Shell Script
12 7 (0.46%) Swift
13 5 (0.33%) Data Analysis Expressions
13 5 (0.33%) SOQL
13 5 (0.33%) T-SQL
14 4 (0.26%) VB
Qualifications
1 279 (18.30%) Degree
2 108 (7.08%) Computer Science Degree
3 80 (5.25%) BPSS Clearance
4 65 (4.26%) TOGAF Certification
5 38 (2.49%) Security Cleared
6 31 (2.03%) PMI Certification
7 22 (1.44%) SC Cleared
8 16 (1.05%) CSPO
9 13 (0.85%) ISTQB
10 12 (0.79%) Azure Certification
11 11 (0.72%) Microsoft Certification
11 11 (0.72%) PMP
12 6 (0.39%) AWS Certification
12 6 (0.39%) CCA
12 6 (0.39%) Master's Degree
13 5 (0.33%) ISEB
14 4 (0.26%) CISSP
14 4 (0.26%) DBS Check
14 4 (0.26%) DV Cleared
14 4 (0.26%) Six Sigma Green Belt
Quality Assurance & Compliance
1 324 (21.25%) QA
2 123 (8.07%) Accessibility
3 39 (2.56%) Data Quality
4 16 (1.05%) GDPR
5 12 (0.79%) ISO 20022
6 10 (0.66%) WCAG
7 7 (0.46%) PMO
8 6 (0.39%) PCI DSS
9 5 (0.33%) Automotive SPICE
9 5 (0.33%) ISO 26262
10 4 (0.26%) Basel II
10 4 (0.26%) Basel III
10 4 (0.26%) Dodd-Frank
10 4 (0.26%) IFRS
10 4 (0.26%) IFRS 9
10 4 (0.26%) SLA
11 3 (0.20%) Cyber Essentials
11 3 (0.20%) ISO/IEC 27001
11 3 (0.20%) PMBOK
11 3 (0.20%) SEPA
System Software
1 319 (20.92%) Docker
2 13 (0.85%) Active Directory
3 9 (0.59%) Virtual Machines
4 7 (0.46%) Embedded Firmware
4 7 (0.46%) Firmware
5 2 (0.13%) Virtual Desktop
5 2 (0.13%) VMware Infrastructure
6 1 (0.066%) Hyper-V
6 1 (0.066%) RACF
Systems Management
1 336 (22.03%) Kubernetes
2 52 (3.41%) Terraform
3 10 (0.66%) Ansible
4 8 (0.52%) Grafana
5 6 (0.39%) Prometheus
6 5 (0.33%) Functional Safety
6 5 (0.33%) Single Sign-On
7 3 (0.20%) Argo
7 3 (0.20%) FortiGate
8 2 (0.13%) Graylog
8 2 (0.13%) Istio
8 2 (0.13%) Kustomize
8 2 (0.13%) Microsoft Intune
8 2 (0.13%) SCCM
9 1 (0.066%) HP ALM
9 1 (0.066%) Kibana
9 1 (0.066%) logstash
9 1 (0.066%) Oracle RMAN
9 1 (0.066%) Puppet
9 1 (0.066%) Systems Management Server (SMS)
Vendors
1 250 (16.39%) Microsoft
2 247 (16.20%) Solace
3 134 (8.79%) Salesforce
4 93 (6.10%) ServiceNow
5 65 (4.26%) Sparx
6 61 (4.00%) Google
7 41 (2.69%) Databricks
8 40 (2.62%) SAP
9 23 (1.51%) Oracle
10 17 (1.11%) Adobe
11 11 (0.72%) IBM
12 9 (0.59%) Atlassian
13 8 (0.52%) Bloomberg
14 7 (0.46%) Cisco
14 7 (0.46%) Foundry
15 6 (0.39%) Apple
15 6 (0.39%) Sitecore
15 6 (0.39%) Splunk
15 6 (0.39%) Workday
16 5 (0.33%) Sybase