Security Clearance
UK

The following table provides summary statistics for permanent job vacancies with a requirement for Security Cleared qualifications. Included is a benchmarking guide to the salaries offered over the 6 months to 2 December 2023 with a comparison to the same period in the previous 2 years.

6 months to
2 Dec 2023
Same period 2022 Same period 2021
Rank 16 50 65
Rank change year-on-year +34 +15 -4
Permanent jobs citing Security Cleared 6,167 7,682 5,964
As % of all permanent jobs advertised in the UK 11.56% 6.13% 4.61%
As % of the Qualifications category 35.46% 20.66% 18.61%
Number of salaries quoted 3,207 3,425 3,077
10th Percentile £32,863 £31,250 £34,715
25th Percentile £45,000 £42,000 £43,750
Median annual salary (50th Percentile) £57,500 £57,500 £60,000
Median % change year-on-year - -4.17% +9.09%
75th Percentile £72,500 £75,000 £75,000
90th Percentile £85,000 £90,000 £87,500
UK excluding London median annual salary £55,000 £52,500 £55,000
% change year-on-year +4.76% -4.55% +4.76%

All Academic and Professional Certifications
UK

Security Cleared is in the Academic Qualifications and Professional Certifications category. The following table is for comparison with the above and provides summary statistics for all permanent job vacancies with a requirement for academic qualifications or professional certifications.

Permanent vacancies requiring academic qualifications or professional certifications 17,393 37,176 32,044
As % of all permanent jobs advertised in the UK 32.59% 29.66% 24.78%
Number of salaries quoted 10,886 17,163 17,940
10th Percentile £31,229 £31,250 £31,250
25th Percentile £42,000 £41,250 £41,000
Median annual salary (50th Percentile) £57,500 £57,000 £55,000
Median % change year-on-year +0.88% +3.64% -
75th Percentile £75,000 £76,250 £72,500
90th Percentile £92,500 £93,750 £90,000
UK excluding London median annual salary £52,500 £50,000 £50,000
% change year-on-year +5.00% - +2.04%

Security Cleared
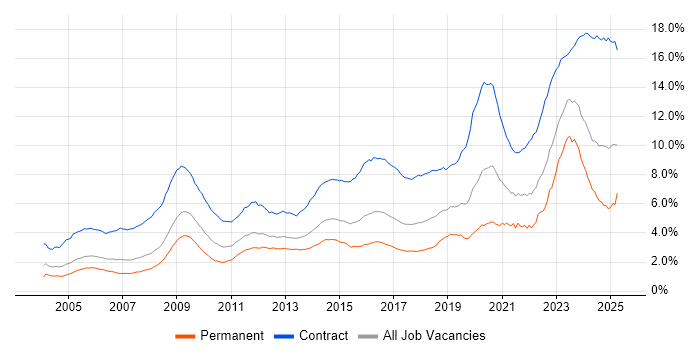
Job Vacancy Trend

Job postings citing Security Cleared as a proportion of all IT jobs advertised.

Job vacancy trend for Security Cleared in the UK

Security Cleared
Salary Trend

3-month moving average salary quoted in jobs citing Security Cleared.

Salary trend for Security Cleared in the UK

Security Cleared
Salary Histogram

Salary distribution for jobs citing Security Cleared over the 6 months to 2 December 2023.

Salary histogram for Security Cleared in the UK

Security Cleared
Top 17 Job Locations

The table below looks at the demand and provides a guide to the median salaries quoted in IT jobs citing Security Cleared within the UK over the 6 months to 2 December 2023. The 'Rank Change' column provides an indication of the change in demand within each location based on the same 6 month period last year.

Location Rank Change
on Same Period
Last Year
Matching
Permanent
IT Job Ads
Median Salary
Past 6 Months
Median Salary
% Change
on Same Period
Last Year
Live
Jobs
England +35 5,147 £57,500 +4.55% 2,154
UK excluding London +21 4,734 £55,000 +4.76% 1,728
Work from Home +28 2,808 £60,000 - 991
South West +5 1,380 £55,000 - 515
South East +16 1,357 £53,760 +5.46% 546
London +79 902 £70,000 +7.69% 493
North of England +85 715 £60,000 +9.09% 228
North West +53 508 £61,000 +16.19% 161
Midlands +58 459 £55,000 - 185
Scotland +35 297 £50,000 -9.09% 103
West Midlands +55 284 £55,000 - 135
Wales +8 269 £55,119 +10.24% 43
East Midlands +48 175 £58,250 +1.30% 50
Yorkshire +113 172 £59,000 -9.92% 45
East of England +13 160 £58,500 +23.16% 142
Northern Ireland +58 142 £64,500 +50.00% 3
North East +17 38 £56,145 -10.17% 23

Security Cleared
Co-occurring Skills and Capabilities by Category

The follow tables expand on the table above by listing co-occurrences grouped by category. The same employment type, locality and period is covered with up to 20 co-occurrences shown in each of the following categories:

Application Platforms
1 105 (1.70%) SharePoint
2 100 (1.62%) IIS
3 93 (1.51%) WebLogic
4 88 (1.43%) Red Hat Fuse
5 87 (1.41%) JBoss
6 66 (1.07%) Confluence
7 46 (0.75%) MS Exchange
8 41 (0.66%) Apache
9 37 (0.60%) Apache Spark
10 23 (0.37%) Jupyter
11 20 (0.32%) WebSphere
12 19 (0.31%) nginx
13 14 (0.23%) OpenStack
13 14 (0.23%) WebSphere Application Server
14 9 (0.15%) WinCC
15 8 (0.13%) Oracle Service Bus
15 8 (0.13%) SharePoint 2013
16 7 (0.11%) ArcGIS
16 7 (0.11%) Oracle Workflow
16 7 (0.11%) SharePoint 2010
Applications
1 161 (2.61%) Microsoft Office
2 99 (1.61%) Microsoft Excel
3 64 (1.04%) Microsoft PowerPoint
4 33 (0.54%) Microsoft Project
5 16 (0.26%) MS Visio
5 16 (0.26%) Spreadsheet
6 11 (0.18%) SOLIDWORKS
7 9 (0.15%) Autodesk Inventor
8 8 (0.13%) Windchill
9 6 (0.097%) AutoCAD
9 6 (0.097%) OrCAD
9 6 (0.097%) PTC Creo
10 5 (0.081%) Chatbot
10 5 (0.081%) Trello
11 4 (0.065%) Adobe Premiere
12 3 (0.049%) Acrobat
12 3 (0.049%) Simulink
13 2 (0.032%) Adobe Creative Suite
13 2 (0.032%) Adobe XD
13 2 (0.032%) InVision
Business Applications
1 42 (0.68%) Remedy ITSM
2 37 (0.60%) SAP S/4HANA
3 23 (0.37%) Primavera
3 23 (0.37%) Sparx Enterprise Architect
4 17 (0.28%) Siebel CRM
5 16 (0.26%) Maximo
6 15 (0.24%) Dynamics CRM
7 12 (0.19%) SAP CO
7 12 (0.19%) SAP SCM
8 11 (0.18%) Elite 3E
8 11 (0.18%) SAP FI
8 11 (0.18%) SAP FI/CO
9 10 (0.16%) Oracle EBS
10 8 (0.13%) SAP MM
11 7 (0.11%) Oracle ERP
12 6 (0.097%) Oracle Financials
12 6 (0.097%) SAP HR
12 6 (0.097%) SAP PM
12 6 (0.097%) SAP PS
12 6 (0.097%) SAP SD
Cloud Services
1 1,114 (18.06%) Azure
2 1,009 (16.36%) AWS
3 395 (6.41%) Serverless
4 297 (4.82%) GCP
5 253 (4.10%) Microsoft 365
6 225 (3.65%) Azure DevOps
7 187 (3.03%) OpenShift
8 162 (2.63%) Power Platform
9 145 (2.35%) SaaS
10 129 (2.09%) Cloud Computing
11 98 (1.59%) Entra ID
12 89 (1.44%) AWS CloudFormation
13 79 (1.28%) PaaS
14 78 (1.26%) GitHub
15 77 (1.25%) AWS Lambda
16 69 (1.12%) IaaS
17 58 (0.94%) dbt
18 56 (0.91%) Amazon ECS
18 56 (0.91%) Dynamics 365
19 50 (0.81%) PowerApps
Communications & Networking
1 431 (6.99%) Firewall
2 241 (3.91%) WAN
3 211 (3.42%) DNS
4 201 (3.26%) LAN
5 193 (3.13%) Network Security
6 190 (3.08%) VPN
7 180 (2.92%) TCP/IP
8 166 (2.69%) DHCP
9 145 (2.35%) HTTP
10 99 (1.61%) BGP
11 91 (1.48%) OSPF
12 74 (1.20%) Wireless
13 73 (1.18%) Internet
14 66 (1.07%) SAN
15 64 (1.04%) SMTP
16 53 (0.86%) Cisco Firepower
16 53 (0.86%) SSL
17 51 (0.83%) Cisco ASA
18 49 (0.79%) Intrusion Detection
19 44 (0.71%) SD-WAN
Database & Business Intelligence
1 295 (4.78%) SQL Server
2 193 (3.13%) Elasticsearch
3 148 (2.40%) Big Data
4 147 (2.38%) Relational Database
5 117 (1.90%) PostgreSQL
6 108 (1.75%) Oracle Database
7 107 (1.74%) MongoDB
8 104 (1.69%) RDBMS
9 103 (1.67%) MySQL
10 99 (1.61%) Power BI
11 73 (1.18%) NoSQL
12 65 (1.05%) Data Warehouse
13 59 (0.96%) Hadoop
14 54 (0.88%) Amazon RDS
15 42 (0.68%) Oracle Reports
16 38 (0.62%) GIS
16 38 (0.62%) Metadata
16 38 (0.62%) Redis
17 25 (0.41%) Data Lake
18 24 (0.39%) JasperReports
Development Applications
1 389 (6.31%) Git
2 285 (4.62%) Jenkins
3 230 (3.73%) JIRA
4 137 (2.22%) GitLab
5 120 (1.95%) Selenium
6 90 (1.46%) IntelliJ
7 54 (0.88%) Maven
8 51 (0.83%) Cucumber
9 45 (0.73%) Sonatype Nexus
10 40 (0.65%) Robot Framework
11 37 (0.60%) Bitbucket
12 36 (0.58%) Rational DOORS
13 35 (0.57%) Cypress.io
14 34 (0.55%) Oracle APEX
15 32 (0.52%) MSI
15 32 (0.52%) Visual Studio
16 27 (0.44%) Artifactory
17 24 (0.39%) JUnit
18 23 (0.37%) SonarQube
18 23 (0.37%) Team Foundation Server
General
1 1,899 (30.79%) Social Skills
2 735 (11.92%) Public Sector
3 698 (11.32%) Finance
4 585 (9.49%) Inclusion and Diversity
5 486 (7.88%) Analytical Skills
6 345 (5.59%) Presentation Skills
7 259 (4.20%) Games
8 238 (3.86%) Aerospace
9 224 (3.63%) Influencing Skills
10 212 (3.44%) Banking
11 208 (3.37%) Police
12 173 (2.81%) Military
13 151 (2.45%) Retail
14 148 (2.40%) Organisational Skills
15 131 (2.12%) Telecoms
16 104 (1.69%) Law
17 84 (1.36%) Manufacturing
18 67 (1.09%) Electronics
19 65 (1.05%) Legal
20 51 (0.83%) Marketing
Job Titles
1 1,059 (17.17%) Senior
2 976 (15.83%) Architect
3 611 (9.91%) Software Engineer
4 480 (7.78%) Developer
5 439 (7.12%) Consultant
6 436 (7.07%) Analyst
7 416 (6.75%) Solutions Architect
8 297 (4.82%) Lead
9 283 (4.59%) Security Architect
10 275 (4.46%) Infrastructure Engineer
11 273 (4.43%) Project Manager
12 245 (3.97%) DevOps Engineer
13 241 (3.91%) Presales Solution Architect
14 230 (3.73%) Senior Software Engineer
15 195 (3.16%) Java Engineer
16 185 (3.00%) Java Software Engineer
17 181 (2.93%) Systems Engineer
18 179 (2.90%) Business Manager
19 177 (2.87%) Network Engineer
20 174 (2.82%) Development Manager
Libraries, Frameworks & Software Standards
1 405 (6.57%) Spring
2 282 (4.57%) React
3 255 (4.13%) .NET
4 223 (3.62%) REST
5 220 (3.57%) HTML
6 219 (3.55%) Web Services
7 203 (3.29%) XML
8 193 (3.13%) J2EE
9 180 (2.92%) Node.js
10 169 (2.74%) Java EE
11 166 (2.69%) JSON
11 166 (2.69%) SOAP
12 164 (2.66%) AngularJS
13 130 (2.11%) RESTful
14 126 (2.04%) Ruby on Rails
15 101 (1.64%) Hibernate
16 96 (1.56%) CSS
17 91 (1.48%) JPA
18 89 (1.44%) XSD
19 84 (1.36%) ModSecurity
Miscellaneous
1 261 (4.23%) Management Information System
2 232 (3.76%) Data Centre
3 185 (3.00%) PKI
4 183 (2.97%) Cyberattack
5 155 (2.51%) Self-Motivation
6 133 (2.16%) Public Cloud
7 130 (2.11%) Product Ownership
8 129 (2.09%) Cloud Native
9 112 (1.82%) Onboarding
10 111 (1.80%) Algorithms
11 89 (1.44%) Private Cloud
12 88 (1.43%) Driving Licence
13 87 (1.41%) Virtual Team
14 80 (1.30%) Hybrid Cloud
15 79 (1.28%) Cyber Threat
15 79 (1.28%) Greenfield Project
16 74 (1.20%) Operational Technology
17 68 (1.10%) Clustering
18 66 (1.07%) Security Operations Centre
19 65 (1.05%) CMDB
Operating Systems
1 882 (14.30%) Windows
2 795 (12.89%) Linux
3 347 (5.63%) Windows Server
4 256 (4.15%) Unix
5 121 (1.96%) Windows Server 2016
6 119 (1.93%) Windows Server 2019
7 115 (1.86%) Red Hat Enterprise Linux
8 110 (1.78%) Android
9 109 (1.77%) Windows Server 2012
10 100 (1.62%) Windows 10
11 52 (0.84%) CentOS
12 49 (0.79%) Apple iOS
13 40 (0.65%) Windows 7
14 39 (0.63%) Mac OS
15 26 (0.42%) VMS
16 25 (0.41%) Ubuntu
17 24 (0.39%) Solaris
18 20 (0.32%) Windows Server 2003
19 14 (0.23%) Windows NT
20 12 (0.19%) Windows Server 2008
Processes & Methodologies
1 1,880 (30.48%) Actionable Insight
2 1,584 (25.69%) Agile
3 1,406 (22.80%) Problem-Solving
4 946 (15.34%) Software Engineering
5 908 (14.72%) DevOps
6 827 (13.41%) Cybersecurity
7 666 (10.80%) Mentoring
8 638 (10.35%) Containerisation
9 581 (9.42%) Coaching
10 518 (8.40%) ITIL
11 509 (8.25%) CI/CD
12 503 (8.16%) Analytics
13 455 (7.38%) Microservices
14 425 (6.89%) Project Management
15 420 (6.81%) Continuous Integration
16 389 (6.31%) Project Delivery
17 388 (6.29%) Design Patterns
18 385 (6.24%) Presales
19 384 (6.23%) Business Case
20 378 (6.13%) SIEM
Programming Languages
1 1,104 (17.90%) Python
2 1,102 (17.87%) Java
3 549 (8.90%) SQL
4 482 (7.82%) PowerShell
5 433 (7.02%) JavaScript
6 430 (6.97%) C#
7 313 (5.08%) Bash
8 235 (3.81%) Ruby
9 223 (3.62%) C++
10 152 (2.46%) Go
11 140 (2.27%) C
12 112 (1.82%) Perl
13 91 (1.48%) Shell Script
14 71 (1.15%) PL/SQL
15 68 (1.10%) TypeScript
16 56 (0.91%) VB
17 54 (0.88%) R
18 52 (0.84%) VBScript
19 40 (0.65%) MATLAB
20 30 (0.49%) Rust
Qualifications
1 3,822 (61.98%) SC Cleared
2 1,333 (21.62%) DV Cleared
3 903 (14.64%) Degree
4 239 (3.88%) BPSS Clearance
5 212 (3.44%) CISSP
6 197 (3.19%) Cisco Certification
7 141 (2.29%) CISM
8 138 (2.24%) Computer Science Degree
9 136 (2.21%) CCNA
10 133 (2.16%) AWS Certification
11 118 (1.91%) CCNP
12 102 (1.65%) Master's Degree
13 98 (1.59%) CRISC
14 87 (1.41%) CISA
15 86 (1.39%) Azure Certification
16 81 (1.31%) Microsoft Certification
17 68 (1.10%) AWS Certified Solutions Architect
18 65 (1.05%) TOGAF Certification
19 52 (0.84%) HNC
20 49 (0.79%) CESG Certified Professional
Quality Assurance & Compliance
1 284 (4.61%) QA
2 248 (4.02%) ISO/IEC 27001
3 159 (2.58%) SLA
4 143 (2.32%) NIST
5 99 (1.61%) GRC
6 85 (1.38%) NCSC
7 67 (1.09%) Accessibility
7 67 (1.09%) Cyber Essentials
8 61 (0.99%) ISO 22301
9 45 (0.73%) ISO 9001
10 43 (0.70%) RMADS
11 42 (0.68%) Data Quality
12 39 (0.63%) HMG Security Policy Framework
13 36 (0.58%) NIST 800
14 33 (0.54%) JSP 440
15 30 (0.49%) Cyber Essentials PLUS
16 25 (0.41%) ISO/IEC 15288
17 23 (0.37%) PMO
18 17 (0.28%) ISO/IEC 17025
18 17 (0.28%) Software Quality Assurance
System Software
1 551 (8.93%) Active Directory
2 385 (6.24%) Docker
3 381 (6.18%) VMware Infrastructure
4 283 (4.59%) Virtual Machines
5 195 (3.16%) Hyper-V
6 90 (1.46%) Firmware
7 67 (1.09%) VMware ESXi
8 56 (0.91%) vSphere
9 55 (0.89%) VMware NSX
10 31 (0.50%) Virtual Desktop
11 26 (0.42%) Virtual Servers
12 16 (0.26%) Microsoft App-V
13 12 (0.19%) Oracle RAC
14 10 (0.16%) KVM
15 7 (0.11%) XenApp
16 6 (0.097%) Citrix Hypervisor
16 6 (0.097%) HDFS
17 5 (0.081%) Embedded Firmware
18 4 (0.065%) Squid
18 4 (0.065%) Terminal Services
Systems Management
1 449 (7.28%) Kubernetes
2 350 (5.68%) Terraform
3 315 (5.11%) Ansible
4 207 (3.36%) SCCM
5 120 (1.95%) Puppet
6 108 (1.75%) SCOM
7 91 (1.48%) Single Sign-On
8 83 (1.35%) OpenSSO
9 80 (1.30%) vCenter Server
10 77 (1.25%) WSUS
11 69 (1.12%) Microsoft Intune
12 62 (1.01%) FortiGate
13 47 (0.76%) Grafana
14 35 (0.57%) Active Directory Federation Services
15 31 (0.50%) AirWatch
16 29 (0.47%) Prometheus
17 27 (0.44%) VxRail
18 26 (0.42%) Nessus
19 25 (0.41%) Packer
20 23 (0.37%) Progress Chef
Vendors
1 943 (15.29%) Microsoft
2 542 (8.79%) VMware
3 511 (8.29%) Oracle
4 357 (5.79%) Cisco
5 209 (3.39%) Juniper
6 204 (3.31%) ServiceNow
7 143 (2.32%) SAP
8 140 (2.27%) Remedy
9 114 (1.85%) Red Hat
10 112 (1.82%) Google
11 110 (1.78%) CheckPoint
12 91 (1.48%) F5
13 84 (1.36%) Fortinet
14 83 (1.35%) IBM
15 81 (1.31%) HP
16 78 (1.26%) Splunk
17 74 (1.20%) CA
18 65 (1.05%) Palo Alto
19 55 (0.89%) SolarWinds
20 52 (0.84%) Citrix