Private Cloud Jobs

Private Cloud
UK

The table below looks at the prevalence of the term Private Cloud in permanent job vacancies. Included is a benchmarking guide to the salaries offered in vacancies that cited Private Cloud over the 6 months leading up to 16 May 2025, comparing them to the same period in the previous two years.

6 months to
16 May 2025
Same period 2024 Same period 2023
Rank 536 537 404
Rank change year-on-year +1 -133 +239
Permanent jobs citing Private Cloud 176 393 800
As % of all permanent jobs advertised in the UK 0.32% 0.40% 0.80%
As % of the Miscellaneous category 0.87% 1.12% 1.84%
Number of salaries quoted 119 301 344
10th Percentile £47,250 £35,920 £39,294
25th Percentile £52,500 £48,750 £51,833
Median annual salary (50th Percentile) £70,000 £65,000 £65,000
Median % change year-on-year +7.69% - -3.70%
75th Percentile £80,000 £82,500 £82,500
90th Percentile £92,756 £91,250 £94,504
UK excluding London median annual salary £65,250 £65,000 £60,249
% change year-on-year +0.38% +7.89% +0.42%

All Generic Skills
UK

Private Cloud falls under the General and Transferable Skills category. For comparison with the information above, the following table provides summary statistics for all permanent job vacancies requiring generic IT skills.

Permanent vacancies with a requirement for generic IT skills 20,334 35,170 43,380
As % of all permanent jobs advertised in the UK 36.63% 35.46% 43.51%
Number of salaries quoted 9,874 23,008 23,167
10th Percentile £31,250 £28,000 £35,321
25th Percentile £42,500 £38,000 £46,250
Median annual salary (50th Percentile) £60,000 £55,000 £65,000
Median % change year-on-year +9.09% -15.38% +4.00%
75th Percentile £78,750 £75,000 £86,250
90th Percentile £110,000 £97,500 £108,750
UK excluding London median annual salary £55,000 £50,000 £55,000
% change year-on-year +10.00% -9.09% +4.76%

Private Cloud
Job Vacancy Trend

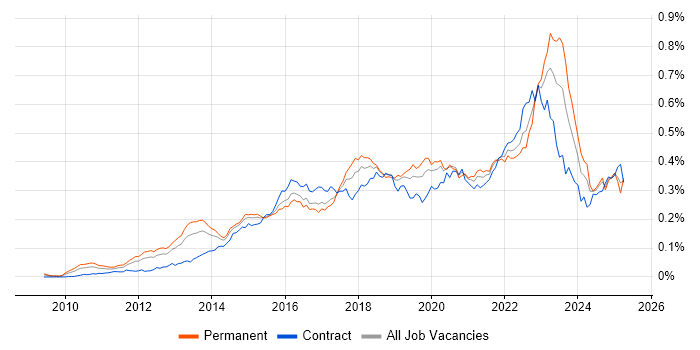
Job postings citing Private Cloud as a proportion of all IT jobs advertised.

Job vacancy trend for Private Cloud in the UK

Private Cloud
Salary Trend

3-month moving average salary quoted in jobs citing Private Cloud.

Salary trend for Private Cloud in the UK

Private Cloud
Salary Histogram

Salary distribution for jobs citing Private Cloud over the 6 months to 16 May 2025.

Salary histogram for Private Cloud in the UK

Private Cloud
Top 16 Job Locations

The table below looks at the demand and provides a guide to the median salaries quoted in IT jobs citing Private Cloud within the UK over the 6 months to 16 May 2025. The 'Rank Change' column provides an indication of the change in demand within each location based on the same 6 month period last year.

Location Rank Change
on Same Period
Last Year
Matching
Permanent
IT Job Ads
Median Salary
Past 6 Months
Median Salary
% Change
on Same Period
Last Year
Live
Jobs
England -19 143 £70,000 +7.69% 124
UK excluding London +44 140 £65,250 +0.38% 83
Work from Home -17 68 £71,991 +10.76% 89
North of England -6 37 £75,000 +39.53% 19
London +56 34 £80,000 +13.35% 51
South East +74 23 £60,000 -20.00% 21
Yorkshire +46 20 £127,680 +122.05% 1
Midlands +44 20 £55,000 -12.00% 12
Scotland +76 18 £74,870 -0.17% 6
South West +70 18 £60,000 -9.43% 21
West Midlands +40 17 £55,000 -8.33% 11
North West -20 16 £70,000 +16.67% 16
East of England - 14 £70,000 -
Wales +43 13 £27,500 -63.33% 1
East Midlands +29 3 £60,000 -20.00% 1
North East +36 1 £85,000 +61.90% 3

Private Cloud
Co-occurring Skills and Capabilities by Category

The follow tables expand on the table above by listing co-occurrences grouped by category. The same employment type, locality and period is covered with up to 20 co-occurrences shown in each of the following categories:

Application Platforms
1 26 (14.77%) Microsoft Exchange
2 18 (10.23%) IIS
3 4 (2.27%) OpenStack
4 2 (1.14%) CICS
4 2 (1.14%) Confluence
4 2 (1.14%) nginx
5 1 (0.57%) SharePoint
Applications
1 22 (12.50%) Microsoft Office
2 8 (4.55%) Microsoft Excel
2 8 (4.55%) MS Visio
Business Applications
1 5 (2.84%) Dynamics CRM
2 2 (1.14%) Cloudability
2 2 (1.14%) SAP S/4HANA
3 1 (0.57%) Oracle EBS
3 1 (0.57%) Oracle Payables
3 1 (0.57%) SAP CO
3 1 (0.57%) SAP FI
3 1 (0.57%) SAP FI/CO
Cloud Services
1 92 (52.27%) Azure
2 61 (34.66%) AWS
3 50 (28.41%) SaaS
4 28 (15.91%) Microsoft 365
5 24 (13.64%) GCP
6 14 (7.95%) IaaS
7 13 (7.39%) PaaS
8 12 (6.82%) OpenShift
8 12 (6.82%) Power Platform
9 10 (5.68%) Entra ID
10 7 (3.98%) GitHub
11 6 (3.41%) Serverless
12 5 (2.84%) Dynamics 365
13 3 (1.70%) Amazon EC2
13 3 (1.70%) Amazon S3
13 3 (1.70%) AWS Lambda
14 2 (1.14%) Cloud Computing
14 2 (1.14%) Snowflake
15 1 (0.57%) Azure App Service
15 1 (0.57%) Nutanix
Communications & Networking
1 18 (10.23%) Firewall
2 17 (9.66%) DNS
3 13 (7.39%) IP Telephony
4 12 (6.82%) SAN
5 10 (5.68%) Intrusion Detection
5 10 (5.68%) Structured Cabling
5 10 (5.68%) WAN
6 9 (5.11%) DHCP
7 8 (4.55%) Cisco IOS
7 8 (4.55%) FTP
7 8 (4.55%) IPv4
7 8 (4.55%) PBX
7 8 (4.55%) SMTP
7 8 (4.55%) VLAN
8 7 (3.98%) NetScaler
8 7 (3.98%) Network Security
8 7 (3.98%) VPN
9 6 (3.41%) MPLS
10 4 (2.27%) LAN
11 3 (1.70%) Internet
Database & Business Intelligence
1 30 (17.05%) SQL Server
2 16 (9.09%) Data Hub
2 16 (9.09%) SQL CLR
3 12 (6.82%) Power BI
4 11 (6.25%) Amazon RDS
5 10 (5.68%) Metadata
5 10 (5.68%) SQL Server Analysis Services
5 10 (5.68%) SQL Server Reporting Services
6 4 (2.27%) NoSQL
7 3 (1.70%) DynamoDB
7 3 (1.70%) Relational Database
8 2 (1.14%) Amazon QuickSight
8 2 (1.14%) MySQL
8 2 (1.14%) PostgreSQL
8 2 (1.14%) Tableau
9 1 (0.57%) DB2
Development Applications
1 10 (5.68%) GitLab
2 5 (2.84%) JIRA
3 2 (1.14%) Git
3 2 (1.14%) Jenkins
4 1 (0.57%) IBM UrbanCode
4 1 (0.57%) MSI
4 1 (0.57%) Selenium
4 1 (0.57%) Visual Studio Code
General
1 79 (44.89%) Social Skills
2 72 (40.91%) Finance
3 23 (13.07%) Banking
4 16 (9.09%) Back Office
5 13 (7.39%) Telecoms
6 8 (4.55%) Marketing
6 8 (4.55%) Presentation Skills
7 6 (3.41%) Analytical Skills
7 6 (3.41%) Public Sector
8 4 (2.27%) Inclusion and Diversity
8 4 (2.27%) Influencing Skills
8 4 (2.27%) Organisational Skills
9 2 (1.14%) Billing
10 1 (0.57%) French Language
10 1 (0.57%) Law
10 1 (0.57%) Retail
Job Titles
1 36 (20.45%) Senior
2 30 (17.05%) Lead
3 18 (10.23%) Architect
4 17 (9.66%) Software Engineer
5 15 (8.52%) Developer
6 14 (7.95%) Service Manager
7 13 (7.39%) Full-Stack Engineer
7 13 (7.39%) Senior Developer
7 13 (7.39%) Technical Engineer
8 12 (6.82%) Full-Stack Software Engineer
8 12 (6.82%) Solutions Architect
9 11 (6.25%) Consultant
9 11 (6.25%) IT Manager
10 10 (5.68%) Microsoft Developer
10 10 (5.68%) SaaS Developer
10 10 (5.68%) Senior Microsoft Developer
10 10 (5.68%) Senior SQL Developer
10 10 (5.68%) SQL Developer
11 9 (5.11%) Service Desk Manager
12 8 (4.55%) Infrastructure Consultant
Libraries, Frameworks & Software Standards
1 19 (10.80%) .NET
2 17 (9.66%) React
3 7 (3.98%) .NET Core
4 6 (3.41%) .NET Framework
4 6 (3.41%) Dapper ORM
4 6 (3.41%) Entity Framework
4 6 (3.41%) Spring Boot
5 5 (2.84%) Kafka
5 5 (2.84%) REST
6 4 (2.27%) AngularJS
6 4 (2.27%) Spring
7 3 (1.70%) JSON
7 3 (1.70%) Middleware
7 3 (1.70%) OAuth
7 3 (1.70%) RESTful
7 3 (1.70%) Vue
8 2 (1.14%) Web Services
9 1 (0.57%) gRPC
9 1 (0.57%) RabbitMQ
9 1 (0.57%) SAP Basis
Miscellaneous
1 30 (17.05%) Public Cloud
2 22 (12.50%) Management Information System
3 13 (7.39%) Data Centre
4 12 (6.82%) Client/Server
4 12 (6.82%) Product Ownership
5 9 (5.11%) Cloud Native
6 7 (3.98%) Tandem
7 6 (3.41%) Team-Oriented Environment
8 5 (2.84%) Hybrid Cloud
8 5 (2.84%) Self-Motivation
9 4 (2.27%) Enterprise Software
9 4 (2.27%) PKI
10 2 (1.14%) Credit Risk
10 2 (1.14%) Driving Licence
11 1 (0.57%) EMC VMAX
11 1 (0.57%) Enterprise Cloud
11 1 (0.57%) Enterprise Storage
11 1 (0.57%) Legacy Systems
11 1 (0.57%) Onboarding
11 1 (0.57%) Operational Technology
Operating Systems
1 35 (19.89%) Windows
2 22 (12.50%) Windows Server
3 11 (6.25%) Linux
4 8 (4.55%) Android
4 8 (4.55%) Windows 10
5 1 (0.57%) Debian
5 1 (0.57%) zOS
Processes & Methodologies
1 59 (33.52%) Problem-Solving
2 52 (29.55%) Agile
3 47 (26.70%) Software Engineering
4 45 (25.57%) Roadmaps
5 37 (21.02%) ITIL
6 35 (19.89%) CI/CD
7 33 (18.75%) DevOps
8 28 (15.91%) Mentoring
9 26 (14.77%) Continuous Improvement
9 26 (14.77%) Infrastructure Engineering
10 24 (13.64%) Full-Stack Development
11 23 (13.07%) Microservices
12 22 (12.50%) Continuous Integration
12 22 (12.50%) Information Security
13 20 (11.36%) Coaching
14 19 (10.80%) High Availability
15 18 (10.23%) Commercial Awareness
15 18 (10.23%) Containerisation
15 18 (10.23%) Performance Tuning
15 18 (10.23%) Technical Leadership
Programming Languages
1 40 (22.73%) Python
2 34 (19.32%) Java
3 24 (13.64%) PowerShell
4 21 (11.93%) SQL
5 17 (9.66%) C#
6 15 (8.52%) JavaScript
7 10 (5.68%) Bash
7 10 (5.68%) T-SQL
8 5 (2.84%) TypeScript
9 2 (1.14%) JCL
10 1 (0.57%) Bicep
10 1 (0.57%) C++
10 1 (0.57%) Go
Qualifications
1 30 (17.05%) Security Cleared
2 21 (11.93%) SC Cleared
3 12 (6.82%) ITIL Certification
4 11 (6.25%) Cisco Certification
4 11 (6.25%) Degree
5 10 (5.68%) CCNA
5 10 (5.68%) DV Cleared
6 8 (4.55%) Microsoft Certification
6 8 (4.55%) Network+ Certification
7 7 (3.98%) Azure Certification
8 2 (1.14%) AWS Certification
8 2 (1.14%) CCNP
9 1 (0.57%) (ISC)2 CCSP
9 1 (0.57%) AWS Certified Solutions Architect
9 1 (0.57%) CCSP
9 1 (0.57%) CEH
9 1 (0.57%) CISM
9 1 (0.57%) CISSP
9 1 (0.57%) OSCP
9 1 (0.57%) VMware Certified Professional (VCP)
Quality Assurance & Compliance
1 13 (7.39%) SLA
2 11 (6.25%) COBIT
2 11 (6.25%) ISO/IEC 27001
3 3 (1.70%) GDPR
3 3 (1.70%) QA
4 1 (0.57%) NIST
4 1 (0.57%) PCI DSS
4 1 (0.57%) Sarbanes-Oxley
System Software
1 32 (18.18%) Docker
1 32 (18.18%) VMware Infrastructure
2 14 (7.95%) Hyper-V
3 13 (7.39%) Virtual Desktop
4 11 (6.25%) Active Directory
5 8 (4.55%) VMware ESXi
6 1 (0.57%) Virtual Machines
6 1 (0.57%) vSphere
Systems Management
1 39 (22.16%) Kubernetes
2 10 (5.68%) Failover Clustering
2 10 (5.68%) Microsoft Intune
2 10 (5.68%) Terraform
3 8 (4.55%) SCCM
3 8 (4.55%) WSUS
4 6 (3.41%) Proxmox
5 4 (2.27%) Ansible
6 3 (1.70%) WMI
7 2 (1.14%) Podman
7 2 (1.14%) Puppet
8 1 (0.57%) CA Service Virtualization
8 1 (0.57%) Grafana
8 1 (0.57%) Progress Chef
8 1 (0.57%) Prometheus
8 1 (0.57%) vCenter Server
8 1 (0.57%) vRealize
Vendors
1 75 (42.61%) Microsoft
2 35 (19.89%) VMware
3 18 (10.23%) Cisco
4 17 (9.66%) Google
5 16 (9.09%) Oracle
6 15 (8.52%) Citrix
7 9 (5.11%) Veeam
8 5 (2.84%) HubSpot
9 3 (1.70%) IBM
9 3 (1.70%) SAP
10 2 (1.14%) Databricks
10 2 (1.14%) F5
10 2 (1.14%) Graphcore
11 1 (0.57%) Arista
11 1 (0.57%) Brocade
11 1 (0.57%) EMC
11 1 (0.57%) HP
11 1 (0.57%) Juniper
11 1 (0.57%) ServiceNow
11 1 (0.57%) Splunk