Billing
UK

The table below looks at the prevalence of the term Billing in permanent job vacancies. Included is a benchmarking guide to the salaries offered in vacancies that cited Billing over the 6 months leading up to 23 October 2024, comparing them to the same period in the previous two years.

6 months to
23 Oct 2024
Same period 2023 Same period 2022
Rank 397 453 737
Rank change year-on-year +56 +284 -241
Permanent jobs citing Billing 454 335 460
As % of all permanent jobs advertised in the UK 0.60% 0.56% 0.33%
As % of the General category 1.03% 0.85% 0.48%
Number of salaries quoted 94 117 237
10th Percentile £24,196 £28,500 £26,500
25th Percentile £30,875 £45,000 £40,000
Median annual salary (50th Percentile) £41,750 £65,000 £59,000
Median % change year-on-year -35.77% +10.17% -1.67%
75th Percentile £70,000 £80,000 £77,500
90th Percentile £87,500 £101,750 £95,000
UK excluding London median annual salary £35,000 £50,000 £50,000
% change year-on-year -30.00% - -9.09%

All General Skills
UK

Billing falls under the General Skills category. For comparison with the information above, the following table provides summary statistics for all permanent job vacancies requiring common skills.

Permanent vacancies with a requirement for common skills 44,101 39,349 95,915
As % of all permanent jobs advertised in the UK 58.29% 66.18% 68.25%
Number of salaries quoted 20,105 27,135 50,473
10th Percentile £31,750 £31,250 £32,500
25th Percentile £42,500 £42,500 £44,000
Median annual salary (50th Percentile) £58,033 £60,000 £60,000
Median % change year-on-year -3.28% - +4.35%
75th Percentile £78,750 £80,000 £81,250
90th Percentile £100,000 £100,000 £100,000
UK excluding London median annual salary £50,309 £50,000 £52,500
% change year-on-year +0.62% -4.76% +10.53%

Billing
Job Vacancy Trend

Job postings citing Billing as a proportion of all IT jobs advertised.
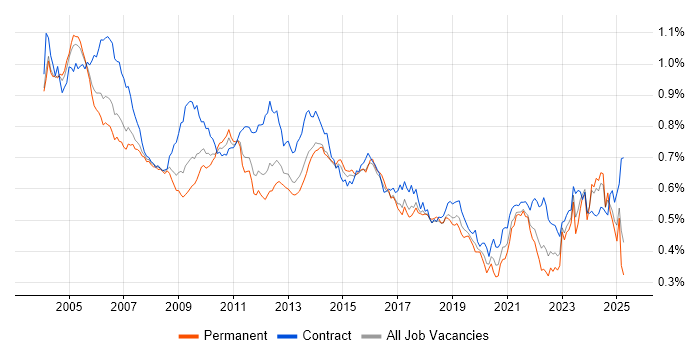
Job vacancy trend for Billing in the UK

Billing
Salary Trend

3-month moving average salary quoted in jobs citing Billing.

Salary trend for Billing in the UK

Billing
Salary Histogram

Salary distribution for jobs citing Billing over the 6 months to 23 October 2024.

Salary histogram for Billing in the UK

Billing
Top 16 Job Locations

The table below looks at the demand and provides a guide to the median salaries quoted in IT jobs citing Billing within the UK over the 6 months to 23 October 2024. The 'Rank Change' column provides an indication of the change in demand within each location based on the same 6 month period last year.

Location Rank Change
on Same Period
Last Year
Matching
Permanent
IT Job Ads
Median Salary
Past 6 Months
Median Salary
% Change
on Same Period
Last Year
Live
Jobs
England +1 358 £42,500 -34.62% 110
UK excluding London +79 321 £35,000 -30.00% 86
Work from Home +113 169 £37,500 -31.82% 181
London -28 114 £75,000 -1.64% 29
North of England +32 99 £24,196 -62.78% 15
North West +49 89 £24,196 -62.78% 8
Scotland +53 75 £45,000 - 5
South East -44 62 £38,500 -23.00% 40
South West +49 55 £47,500 +72.73% 5
Midlands -32 18 £34,000 +19.30% 12
West Midlands -41 10 £32,500 +14.04% 5
Yorkshire +23 9 £42,500 +13.33% 5
East Midlands -21 8 £34,000 +29.52% 7
Wales +43 7 £24,000 -61.37% 1
East of England -51 5 - - 11
North East -32 1 £24,000 - 2

Billing
Co-occurring Skills and Capabilities by Category

The follow tables expand on the table above by listing co-occurrences grouped by category. The same employment type, locality and period is covered with up to 20 co-occurrences shown in each of the following categories:

Application Platforms
1 14 (3.08%) Confluence
1 14 (3.08%) Oracle Collaboration Suite
2 8 (1.76%) CICS
2 8 (1.76%) SharePoint
3 3 (0.66%) Apache
3 3 (0.66%) Apache Spark
4 2 (0.44%) CMS
Applications
1 69 (15.20%) Microsoft Excel
2 32 (7.05%) Microsoft PowerPoint
3 25 (5.51%) Microsoft Office
4 11 (2.42%) Microsoft Project
5 5 (1.10%) Spreadsheet
6 2 (0.44%) Chatbot
Business Applications
1 9 (1.98%) SAP S/4HANA
2 5 (1.10%) SAP SD
3 4 (0.88%) Oracle EBS
4 3 (0.66%) Elite 3E
4 3 (0.66%) Salesforce CRM
5 2 (0.44%) NetSuite
5 2 (0.44%) Unit4 Business World
6 1 (0.22%) Dynamics CRM
6 1 (0.22%) Oracle Applications
6 1 (0.22%) Oracle Assets
6 1 (0.22%) Oracle EBS R12
6 1 (0.22%) Oracle E-Business Tax
6 1 (0.22%) Oracle General Ledger
6 1 (0.22%) Oracle Internet Expenses
6 1 (0.22%) Oracle iProcurement
6 1 (0.22%) Oracle Payables
6 1 (0.22%) Oracle Receivables
6 1 (0.22%) SAP IS-U
6 1 (0.22%) Workday HCM
Cloud Services
1 45 (9.91%) AWS
2 30 (6.61%) Amazon Kinesis
3 23 (5.07%) Azure
4 17 (3.74%) SaaS
5 14 (3.08%) Power Platform
6 13 (2.86%) Microsoft 365
7 10 (2.20%) Azure Monitor
8 6 (1.32%) OCI
9 5 (1.10%) Serverless
10 4 (0.88%) Amazon CloudWatch
10 4 (0.88%) Amazon EC2
10 4 (0.88%) AWS CodePipeline
10 4 (0.88%) AWS Direct Connect
10 4 (0.88%) AWS IoT
10 4 (0.88%) AWS Lambda
10 4 (0.88%) Entra ID
10 4 (0.88%) GCP
10 4 (0.88%) PaaS
10 4 (0.88%) Salesforce Service Cloud
10 4 (0.88%) Virtual Private Cloud
Communications & Networking
1 85 (18.72%) Broadband
2 34 (7.49%) Wi-Fi
3 25 (5.51%) Ethernet
4 14 (3.08%) 3GPP
5 10 (2.20%) Firewall
6 7 (1.54%) Internet
7 4 (0.88%) VLAN
8 3 (0.66%) ASN.1
8 3 (0.66%) SMS
8 3 (0.66%) VPN
8 3 (0.66%) Wireless
9 2 (0.44%) BGP
9 2 (0.44%) DNS
10 1 (0.22%) 3G
10 1 (0.22%) EIGRP
10 1 (0.22%) IPsec
10 1 (0.22%) MPLS
10 1 (0.22%) OSPF
10 1 (0.22%) PSTN
10 1 (0.22%) WAN
Database & Business Intelligence
1 31 (6.83%) NoSQL
2 30 (6.61%) DynamoDB
2 30 (6.61%) PostgreSQL
2 30 (6.61%) Redis
3 27 (5.95%) Amazon Aurora
4 17 (3.74%) SQL Server
5 14 (3.08%) Power BI
6 9 (1.98%) Azure SQL Database
7 7 (1.54%) Data Lake
8 5 (1.10%) Enterprise Data Warehouse
8 5 (1.10%) MySQL
9 4 (0.88%) Qlik Sense
9 4 (0.88%) QlikView
10 3 (0.66%) Amazon RDS
10 3 (0.66%) Big Data
10 3 (0.66%) Elasticsearch
10 3 (0.66%) Flink
10 3 (0.66%) Oracle Reports
11 2 (0.44%) BusinessObjects
11 2 (0.44%) Data Mining
Development Applications
1 30 (6.61%) Gatling
2 6 (1.32%) JIRA
3 5 (1.10%) Bitbucket
3 5 (1.10%) Git
3 5 (1.10%) JMeter
3 5 (1.10%) Maven
3 5 (1.10%) Zephyr
4 1 (0.22%) Jenkins
4 1 (0.22%) Toad
4 1 (0.22%) Travis CI
General
1 214 (47.14%) Social Skills
2 209 (46.04%) Finance
3 92 (20.26%) Games
4 89 (19.60%) Analytical Skills
5 73 (16.08%) Retail
6 67 (14.76%) Telecoms
7 64 (14.10%) Presentation Skills
8 52 (11.45%) Inclusion and Diversity
9 49 (10.79%) Influencing Skills
10 30 (6.61%) Electronics
11 27 (5.95%) Manufacturing
12 12 (2.64%) Marketing
12 12 (2.64%) Military
13 10 (2.20%) Organisational Skills
14 7 (1.54%) Law
15 6 (1.32%) Banking
15 6 (1.32%) Legal
16 5 (1.10%) Back Office
17 4 (0.88%) International Banking
18 3 (0.66%) General Ledger
Job Titles
1 109 (24.01%) Analyst
2 101 (22.25%) Senior
3 58 (12.78%) Senior Analyst
4 38 (8.37%) Audit Manager
5 25 (5.51%) Service Delivery Executive
6 22 (4.85%) Senior Manager
7 21 (4.63%) Infrastructure Manager
7 21 (4.63%) Senior Audit Manager
7 21 (4.63%) Senior Infrastructure Manager
8 20 (4.41%) Project Manager
9 19 (4.19%) Developer
9 19 (4.19%) Financial Analyst
10 17 (3.74%) Software Engineer
11 16 (3.52%) Consultant
12 15 (3.30%) Technical Support
13 14 (3.08%) Support Specialist
13 14 (3.08%) Technical Specialist
13 14 (3.08%) Technical Support Specialist
14 13 (2.86%) Scala Engineer
14 13 (2.86%) Senior Scala Engineer
Libraries, Frameworks & Software Standards
1 31 (6.83%) Web Services
2 30 (6.61%) GraphQL
2 30 (6.61%) REST
3 27 (5.95%) http4s
3 27 (5.95%) Scalaz
4 17 (3.74%) Lambda Expressions
5 7 (1.54%) SAP Fiori
6 6 (1.32%) XML
7 5 (1.10%) HTML
7 5 (1.10%) OpenAPI
7 5 (1.10%) Swagger
8 4 (0.88%) Oracle Fusion
9 3 (0.66%) EDI
9 3 (0.66%) JSON
9 3 (0.66%) Kafka
10 2 (0.44%) ARM Templates
10 2 (0.44%) CodeIgniter
10 2 (0.44%) CSS
10 2 (0.44%) Spring Cloud
11 1 (0.22%) Java EE
Miscellaneous
1 49 (10.79%) Social Media
2 30 (6.61%) Blog
2 30 (6.61%) Media Streaming
3 14 (3.08%) Wiki
4 13 (2.86%) Distributed Systems
5 12 (2.64%) Self-Motivation
6 11 (2.42%) Management Information System
6 11 (2.42%) Onboarding
7 9 (1.98%) Smart Home
8 8 (1.76%) Analytical Mindset
8 8 (1.76%) Mainframe
9 7 (1.54%) Enterprise Software
10 5 (1.10%) IoT
10 5 (1.10%) Linux Command Line
11 4 (0.88%) Data Centre
11 4 (0.88%) Product Ownership
11 4 (0.88%) Reinsurance
12 3 (0.66%) Driving Licence
12 3 (0.66%) Video Conferencing
13 2 (0.44%) Fat Client
Operating Systems
1 14 (3.08%) Unix
2 7 (1.54%) Linux
3 6 (1.32%) Windows
4 2 (0.44%) Solaris
4 2 (0.44%) Windows Server
5 1 (0.22%) VMS
Processes & Methodologies
1 172 (37.89%) Agile
2 134 (29.52%) Problem-Solving
3 126 (27.75%) Coaching
4 114 (25.11%) Service Management
5 109 (24.01%) People Management
6 108 (23.79%) Business Development
7 105 (23.13%) Performance Management
8 54 (11.89%) Computer Science
9 53 (11.67%) Project Management
10 49 (10.79%) Service Delivery
11 41 (9.03%) Integration Testing
11 41 (9.03%) Unit Testing
12 38 (8.37%) Analytics
12 38 (8.37%) Customer Service
12 38 (8.37%) DevOps
13 37 (8.15%) End-to-End Testing
14 33 (7.27%) B2B
15 32 (7.05%) Open Source
16 31 (6.83%) Customer Retention
17 30 (6.61%) A/B Testing
Programming Languages
1 44 (9.69%) SQL
2 30 (6.61%) Scala
3 29 (6.39%) Java
4 14 (3.08%) Shell Script
5 8 (1.76%) Assembly Language
5 8 (1.76%) COBOL
5 8 (1.76%) JCL
6 7 (1.54%) Kotlin
6 7 (1.54%) Python
7 6 (1.32%) Bash
8 5 (1.10%) Groovy
9 4 (0.88%) JavaScript
9 4 (0.88%) PowerShell
9 4 (0.88%) T-SQL
10 2 (0.44%) PHP
11 1 (0.22%) ABAP
11 1 (0.22%) Apex Code
11 1 (0.22%) Perl
11 1 (0.22%) PL/SQL
11 1 (0.22%) SOQL
Qualifications
1 130 (28.63%) ACCA
2 79 (17.40%) Degree
3 46 (10.13%) CCA
4 45 (9.91%) Computer Science Degree
5 19 (4.19%) Security Cleared
6 17 (3.74%) CIMA
6 17 (3.74%) DBS Check
6 17 (3.74%) SC Cleared
7 12 (2.64%) HND
8 11 (2.42%) HNC
9 4 (0.88%) AWS Certification
9 4 (0.88%) AWS Certified Solutions Architect
9 4 (0.88%) AWS Certified SysOps Administrator
9 4 (0.88%) ITIL Certification
10 3 (0.66%) SAP Certification
11 2 (0.44%) DV Cleared
11 2 (0.44%) Microsoft Certification
12 1 (0.22%) CompTIA Security+
12 1 (0.22%) PMI Certification
12 1 (0.22%) PMP
Quality Assurance & Compliance
1 105 (23.13%) GAAP
1 105 (23.13%) IFRS
2 6 (1.32%) SLA
3 4 (0.88%) Data Quality
3 4 (0.88%) GDPR
4 3 (0.66%) HIPAA
4 3 (0.66%) Sarbanes-Oxley
5 2 (0.44%) PMO
System Software
1 5 (1.10%) Active Directory
2 2 (0.44%) Terminal Services
2 2 (0.44%) Virtual Machines
Systems Management
1 14 (3.08%) Amdocs OSS
2 6 (1.32%) Ansible
3 5 (1.10%) Terraform
4 4 (0.88%) FortiGate
4 4 (0.88%) Progress Chef
4 4 (0.88%) Puppet
5 3 (0.66%) Autotask
6 2 (0.44%) BMC PATROL
6 2 (0.44%) Microsoft Intune
7 1 (0.22%) Data Guard
7 1 (0.22%) Kubernetes
Vendors
1 171 (37.67%) Microsoft
2 25 (5.51%) Oracle
3 17 (3.74%) Salesforce
4 14 (3.08%) Amdocs
5 12 (2.64%) SAP
6 5 (1.10%) Google
7 4 (0.88%) Arqiva
7 4 (0.88%) Remedy
7 4 (0.88%) ServiceNow
8 3 (0.66%) Aderant
8 3 (0.66%) BMC
8 3 (0.66%) Databricks
8 3 (0.66%) Intapp
9 2 (0.44%) Adobe
9 2 (0.44%) Bloomberg
9 2 (0.44%) Cisco
9 2 (0.44%) Citrix
9 2 (0.44%) Cognos
9 2 (0.44%) Concur
9 2 (0.44%) Palo Alto