Sarbanes-Oxley (SOX, Sarbox)
UK
The table below provides summary statistics for permanent job vacancies requiring Sarbanes-Oxley skills. It includes a benchmarking guide to the annual salaries offered in vacancies that cited Sarbanes-Oxley over the 6 months leading up to 31 May 2025, comparing them to the same period in the previous two years.
| 6 months to 31 May 2025 |
Same period 2024 | Same period 2023 | |
|---|---|---|---|
| Rank | 553 | 772 | 717 |
| Rank change year-on-year | +219 | -55 | +263 |
| Permanent jobs citing Sarbanes-Oxley | 150 | 135 | 254 |
| As % of all permanent jobs advertised in the UK | 0.27% | 0.13% | 0.27% |
| As % of the Quality Assurance & Compliance category | 1.63% | 0.98% | 1.44% |
| Number of salaries quoted | 51 | 86 | 144 |
| 10th Percentile | - | £29,750 | £44,888 |
| 25th Percentile | £41,250 | £31,250 | £50,938 |
| Median annual salary (50th Percentile) | £60,000 | £52,750 | £61,180 |
| Median % change year-on-year | +13.74% | -13.78% | -2.11% |
| 75th Percentile | £81,875 | £67,500 | £81,250 |
| 90th Percentile | £120,000 | £77,500 | £96,750 |
| UK excluding London median annual salary | £52,500 | £52,500 | £59,875 |
| % change year-on-year | - | -12.32% | +19.75% |
All Quality Assurance and Compliance Skills
UK
Sarbanes-Oxley falls under the Quality Assurance and Compliance category. For comparison with the information above, the following table provides summary statistics for all permanent job vacancies requiring quality assurance or compliance skills.
| Permanent vacancies with a requirement for quality assurance or compliance skills | 9,197 | 13,737 | 17,699 |
| As % of all permanent jobs advertised in the UK | 16.47% | 13.25% | 18.48% |
| Number of salaries quoted | 4,631 | 9,235 | 8,484 |
| 10th Percentile | £31,250 | £26,500 | £32,000 |
| 25th Percentile | £45,000 | £36,250 | £42,500 |
| Median annual salary (50th Percentile) | £60,000 | £52,500 | £57,500 |
| Median % change year-on-year | +14.29% | -8.70% | +4.55% |
| 75th Percentile | £73,000 | £70,000 | £76,250 |
| 90th Percentile | £90,000 | £90,000 | £93,750 |
| UK excluding London median annual salary | £55,000 | £47,500 | £50,000 |
| % change year-on-year | +15.79% | -5.00% | +4.17% |
Sarbanes-Oxley
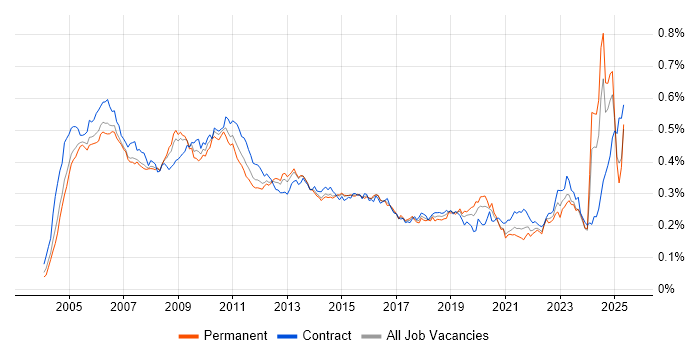
Job Vacancy Trend
Job postings citing Sarbanes-Oxley as a proportion of all IT jobs advertised.

Sarbanes-Oxley
Salary Trend
3-month moving average salary quoted in jobs citing Sarbanes-Oxley.
Sarbanes-Oxley
Salary Histogram
Salary distribution for jobs citing Sarbanes-Oxley over the 6 months to 31 May 2025.
Sarbanes-Oxley
Top 15 Job Locations
The table below looks at the demand and provides a guide to the median salaries quoted in IT jobs citing Sarbanes-Oxley within the UK over the 6 months to 31 May 2025. The 'Rank Change' column provides an indication of the change in demand within each location based on the same 6 month period last year.
| Location | Rank Change on Same Period Last Year |
Matching Permanent IT Job Ads |
Median Salary Past 6 Months |
Median Salary % Change on Same Period Last Year |
Live Jobs |
|---|---|---|---|---|---|
| England | +154 | 110 | £62,500 | +13.64% | 123 |
| UK excluding London | +185 | 106 | £52,500 | - | 56 |
| London | +122 | 40 | £73,750 | +18.00% | 78 |
| Work from Home | +122 | 32 | £72,500 | +20.83% | 58 |
| Scotland | +152 | 31 | - | - | 4 |
| South East | +57 | 26 | £55,000 | +10.00% | 14 |
| North of England | +38 | 26 | £122,773 | +145.55% | 16 |
| North West | +19 | 20 | - | - | 9 |
| Midlands | +48 | 10 | £42,500 | -34.62% | 11 |
| West Midlands | +43 | 10 | £42,500 | -34.62% | 10 |
| East of England | +55 | 7 | £42,500 | - | 2 |
| Yorkshire | +39 | 6 | £122,773 | +277.76% | 7 |
| Northern Ireland | - | 4 | - | - | 5 |
| South West | +112 | 1 | - | - | 3 |
| Wales | - | 1 | - | - |
Sarbanes-Oxley
Co-occurring Skills and Capabilities by Category
The follow tables expand on the table above by listing co-occurrences grouped by category. The same employment type, locality and period is covered with up to 20 co-occurrences shown in each of the following categories:
|
|
||||||||||||||||||||||||||||||||||||||||||||||||||||||||||||||||||||||||||||||||||||||||||||||||||||||
|
|
||||||||||||||||||||||||||||||||||||||||||||||||||||||||||||||||||||||||||||||||||||||||||||||||||||||
|
|
||||||||||||||||||||||||||||||||||||||||||||||||||||||||||||||||||||||||||||||||||||||||||||||||||||||
|
|
||||||||||||||||||||||||||||||||||||||||||||||||||||||||||||||||||||||||||||||||||||||||||||||||||||||
|
|
||||||||||||||||||||||||||||||||||||||||||||||||||||||||||||||||||||||||||||||||||||||||||||||||||||||
|
|
||||||||||||||||||||||||||||||||||||||||||||||||||||||||||||||||||||||||||||||||||||||||||||||||||||||
|
|
||||||||||||||||||||||||||||||||||||||||||||||||||||||||||||||||||||||||||||||||||||||||||||||||||||||
|
|
||||||||||||||||||||||||||||||||||||||||||||||||||||||||||||||||||||||||||||||||||||||||||||||||||||||
|
|
||||||||||||||||||||||||||||||||||||||||||||||||||||||||||||||||||||||||||||||||||||||||||||||||||||||
|
|||||||||||||||||||||||||||||||||||||||||||||||||||||||||||||||||||||||||||||||||||||||||||||||||||||||
