SAP S/4HANA
UK
The table below provides summary statistics for permanent job vacancies requiring SAP S/4HANA skills. It includes a benchmarking guide to the annual salaries offered in vacancies that cited SAP S/4HANA over the 6 months leading up to 30 April 2025, comparing them to the same period in the previous two years.
| 6 months to 30 Apr 2025 |
Same period 2024 | Same period 2023 | |
|---|---|---|---|
| Rank | 424 | 491 | 385 |
| Rank change year-on-year | +67 | -106 | +389 |
| Permanent jobs citing SAP S/4HANA | 276 | 451 | 907 |
| As % of all permanent jobs advertised in the UK | 0.53% | 0.46% | 0.87% |
| As % of the Business Applications category | 9.64% | 10.00% | 15.04% |
| Number of salaries quoted | 151 | 208 | 308 |
| 10th Percentile | £47,500 | £52,500 | £52,000 |
| 25th Percentile | £55,000 | £55,330 | £57,500 |
| Median annual salary (50th Percentile) | £78,000 | £75,250 | £70,000 |
| Median % change year-on-year | +3.65% | +7.50% | +3.70% |
| 75th Percentile | £96,250 | £95,000 | £91,250 |
| 90th Percentile | £115,000 | £106,125 | £117,500 |
| UK excluding London median annual salary | £60,000 | £62,125 | £65,000 |
| % change year-on-year | -3.42% | -4.42% | +18.18% |
All Business Application Skills
UK
SAP S/4HANA falls under the Business Applications category. For comparison with the information above, the following table provides summary statistics for all permanent job vacancies requiring business application skills.
| Permanent vacancies with a requirement for business application skills | 2,864 | 4,508 | 6,032 |
| As % of all permanent jobs advertised in the UK | 5.49% | 4.58% | 5.80% |
| Number of salaries quoted | 1,868 | 2,928 | 3,450 |
| 10th Percentile | £33,525 | £31,250 | £38,750 |
| 25th Percentile | £38,805 | £42,250 | £48,750 |
| Median annual salary (50th Percentile) | £55,000 | £56,000 | £60,000 |
| Median % change year-on-year | -1.79% | -6.67% | +4.35% |
| 75th Percentile | £75,000 | £75,000 | £77,500 |
| 90th Percentile | £100,000 | £92,500 | £95,000 |
| UK excluding London median annual salary | £50,000 | £50,000 | £55,000 |
| % change year-on-year | - | -9.09% | +11.11% |
SAP S/4HANA
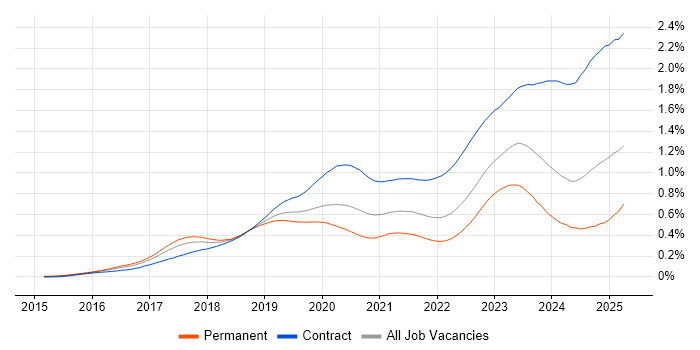
Job Vacancy Trend
Job postings citing SAP S/4HANA as a proportion of all IT jobs advertised.

SAP S/4HANA
Salary Trend
3-month moving average salary quoted in jobs citing SAP S/4HANA.
SAP S/4HANA
Salary Histogram
Salary distribution for jobs citing SAP S/4HANA over the 6 months to 30 April 2025.
SAP S/4HANA
Top 16 Job Locations
The table below looks at the demand and provides a guide to the median salaries quoted in IT jobs citing SAP S/4HANA within the UK over the 6 months to 30 April 2025. The 'Rank Change' column provides an indication of the change in demand within each location based on the same 6 month period last year.
| Location | Rank Change on Same Period Last Year |
Matching Permanent IT Job Ads |
Median Salary Past 6 Months |
Median Salary % Change on Same Period Last Year |
Live Jobs |
|---|---|---|---|---|---|
| England | +98 | 235 | £75,000 | - | 225 |
| UK excluding London | +175 | 152 | £60,000 | -3.42% | 142 |
| Work from Home | +67 | 92 | £80,000 | +3.23% | 180 |
| London | +38 | 70 | £90,000 | - | 88 |
| North of England | +81 | 67 | £53,249 | -15.57% | 36 |
| North West | +47 | 57 | £55,000 | -38.89% | 33 |
| Midlands | +60 | 46 | £70,000 | -3.45% | 23 |
| West Midlands | +53 | 34 | £72,500 | -1.69% | 15 |
| South East | +92 | 31 | £80,000 | +33.33% | 52 |
| East Midlands | +45 | 10 | £68,750 | +17.52% | 8 |
| Yorkshire | +58 | 9 | £42,000 | -23.64% | 2 |
| East of England | +51 | 4 | £65,000 | -7.14% | 12 |
| Wales | - | 2 | £66,811 | - | 4 |
| North East | +47 | 1 | £25,000 | -54.55% | 1 |
| Scotland | - | 1 | £95,000 | - | 11 |
| South West | - | 1 | £150,000 | - | 7 |
SAP S/4HANA
Co-occurring Skills and Capabilities by Category
The follow tables expand on the table above by listing co-occurrences grouped by category. The same employment type, locality and period is covered with up to 20 co-occurrences shown in each of the following categories:
|
|
||||||||||||||||||||||||||||||||||||||||||||||||||||||||||||||||||||||||||||||||||||||||||||||||||||||||||||||||||||||||||||||
|
|
||||||||||||||||||||||||||||||||||||||||||||||||||||||||||||||||||||||||||||||||||||||||||||||||||||||||||||||||||||||||||||||
|
|
||||||||||||||||||||||||||||||||||||||||||||||||||||||||||||||||||||||||||||||||||||||||||||||||||||||||||||||||||||||||||||||
|
|
||||||||||||||||||||||||||||||||||||||||||||||||||||||||||||||||||||||||||||||||||||||||||||||||||||||||||||||||||||||||||||||
|
|
||||||||||||||||||||||||||||||||||||||||||||||||||||||||||||||||||||||||||||||||||||||||||||||||||||||||||||||||||||||||||||||
|
|
||||||||||||||||||||||||||||||||||||||||||||||||||||||||||||||||||||||||||||||||||||||||||||||||||||||||||||||||||||||||||||||
|
|
||||||||||||||||||||||||||||||||||||||||||||||||||||||||||||||||||||||||||||||||||||||||||||||||||||||||||||||||||||||||||||||
|
|
||||||||||||||||||||||||||||||||||||||||||||||||||||||||||||||||||||||||||||||||||||||||||||||||||||||||||||||||||||||||||||||
|
|
||||||||||||||||||||||||||||||||||||||||||||||||||||||||||||||||||||||||||||||||||||||||||||||||||||||||||||||||||||||||||||||
|
|||||||||||||||||||||||||||||||||||||||||||||||||||||||||||||||||||||||||||||||||||||||||||||||||||||||||||||||||||||||||||||||
