SAP
UK

The table below provides summary statistics for permanent job vacancies requiring knowledge or experience of SAP products and/or services. It includes a benchmarking guide to the annual salaries offered in vacancies that cited SAP over the 6 months leading up to 16 January 2025, comparing them to the same period in the previous two years.

The figures below represent the IT labour market in general and are not representative of salaries within SAP SE.

6 months to
16 Jan 2025
Same period 2024 Same period 2023
Rank 140 117 117
Rank change year-on-year -23 0 +33
Permanent jobs citing SAP 1,357 1,607 3,012
As % of all permanent jobs advertised in the UK 2.08% 2.73% 2.81%
As % of the Vendors category 5.94% 6.91% 6.69%
Number of salaries quoted 645 1,025 1,924
10th Percentile £31,350 £33,600 £40,000
25th Percentile £44,000 £46,250 £51,250
Median annual salary (50th Percentile) £60,000 £65,000 £65,000
Median % change year-on-year -7.69% - +4.00%
75th Percentile £87,500 £83,750 £86,000
90th Percentile £106,250 £100,000 £102,500
UK excluding London median annual salary £50,818 £55,000 £60,000
% change year-on-year -7.60% -8.33% +9.09%

All Vendors
UK

SAP falls under the Vendor Products and Services category. For comparison with the information above, the following table provides summary statistics for all permanent job vacancies requiring knowledge or experience of all vendor products and services.

Permanent vacancies with a requirement for knowledge or experience of vendor products and services 22,864 23,271 45,028
As % of all permanent jobs advertised in the UK 35.11% 39.50% 41.99%
Number of salaries quoted 10,784 16,918 26,922
10th Percentile £32,500 £28,375 £31,250
25th Percentile £42,500 £38,000 £41,250
Median annual salary (50th Percentile) £57,000 £55,000 £57,500
Median % change year-on-year +3.64% -4.35% +4.55%
75th Percentile £75,000 £72,500 £78,750
90th Percentile £92,500 £91,250 £95,000
UK excluding London median annual salary £50,818 £47,557 £50,000
% change year-on-year +6.86% -4.89% +5.26%

SAP
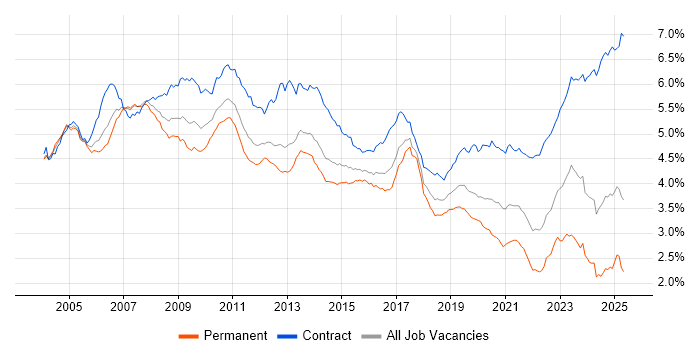
Job Vacancy Trend

Job postings citing SAP as a proportion of all IT jobs advertised.

Job vacancy trend for SAP in the UK

SAP
Salary Trend

3-month moving average salary quoted in jobs citing SAP.

Salary trend for SAP in the UK

SAP
Salary Histogram

Salary distribution for jobs citing SAP over the 6 months to 16 January 2025.

Salary histogram for SAP in the UK

SAP
Top 17 Job Locations

The table below looks at the demand and provides a guide to the median salaries quoted in IT jobs citing SAP within the UK over the 6 months to 16 January 2025. The 'Rank Change' column provides an indication of the change in demand within each location based on the same 6 month period last year.

Location Rank Change
on Same Period
Last Year
Matching
Permanent
IT Job Ads
Median Salary
Past 6 Months
Median Salary
% Change
on Same Period
Last Year
Live
Jobs
England -20 1,203 £57,500 -11.54% 506
UK excluding London -15 846 £50,818 -7.60% 263
Work from Home -28 417 £71,991 +2.84% 353
London -16 410 £90,000 +12.50% 227
North of England +11 255 £50,818 -13.87% 69
North West +40 219 £50,818 -16.35% 55
Midlands +10 216 £46,500 -13.29% 47
South East -29 182 £52,500 -4.55% 90
West Midlands +15 173 £45,000 -25.00% 21
South West -45 57 £62,500 +25.00% 24
East of England -67 55 £70,000 +20.69% 26
East Midlands -34 43 £57,500 +33.72% 26
Scotland -1 41 £89,000 +27.14% 10
Wales +27 35 £47,500 -27.48% 3
Yorkshire -17 33 £52,500 -12.50% 8
Northern Ireland +8 5 £45,000 +28.57% 1
North East -19 3 £45,000 -14.29% 6

SAP
Co-occurring Skills and Capabilities by Category

The follow tables expand on the table above by listing co-occurrences grouped by category. The same employment type, locality and period is covered with up to 20 co-occurrences shown in each of the following categories:

Application Platforms
1 105 (7.74%) SharePoint
2 40 (2.95%) SAS
3 12 (0.88%) CMS
4 11 (0.81%) Confluence
5 10 (0.74%) Microsoft Exchange
6 7 (0.52%) NetWeaver
7 5 (0.37%) Apache
7 5 (0.37%) Tomcat
8 4 (0.29%) WebSphere
9 3 (0.22%) Apache Spark
10 2 (0.15%) Smallworld
10 2 (0.15%) TPMS
10 2 (0.15%) WordPress
Applications
1 169 (12.45%) Microsoft Office
2 108 (7.96%) Microsoft Excel
3 23 (1.69%) Microsoft PowerPoint
4 18 (1.33%) Chatbot
5 17 (1.25%) Microsoft Project
6 4 (0.29%) Maya
7 3 (0.22%) MS Visio
8 2 (0.15%) OrCAD
8 2 (0.15%) Spreadsheet
9 1 (0.074%) EPLAN
9 1 (0.074%) InfoPath
Business Applications
1 324 (23.88%) SAP S/4HANA
2 75 (5.53%) SAP Business One
3 67 (4.94%) SAP ERP
4 62 (4.57%) Salesforce CRM
5 51 (3.76%) Teamcenter
6 40 (2.95%) SAP SD
7 34 (2.51%) SAP FI
8 30 (2.21%) SAP CO
8 30 (2.21%) SAP FI/CO
9 28 (2.06%) OpenText VIM for SAP
10 26 (1.92%) SAP PP
11 24 (1.77%) NetSuite
12 19 (1.40%) SAP PM
13 16 (1.18%) SAP QM
14 15 (1.11%) SAP HR
15 13 (0.96%) SAP HCM
16 12 (0.88%) SAP MM
16 12 (0.88%) Unit4 Business World
17 11 (0.81%) SAP EWM
17 11 (0.81%) SAP MDG
Cloud Services
1 126 (9.29%) Azure
2 80 (5.90%) Power Platform
3 66 (4.86%) AWS
4 63 (4.64%) SuccessFactors
5 52 (3.83%) Microsoft 365
6 43 (3.17%) GCP
7 33 (2.43%) SaaS
8 31 (2.28%) Cloud Computing
8 31 (2.28%) Dynamics 365
9 15 (1.11%) PowerApps
10 14 (1.03%) Boomi
11 13 (0.96%) Azure DevOps
12 12 (0.88%) BigCommerce
12 12 (0.88%) PaaS
12 12 (0.88%) Power Automate
12 12 (0.88%) Salesforce Commerce Cloud
12 12 (0.88%) WhatsApp
13 11 (0.81%) Azure Data Factory
14 10 (0.74%) Veeva
15 9 (0.66%) SAP Commerce Cloud
Communications & Networking
1 60 (4.42%) Broadband
2 17 (1.25%) Wireless
3 14 (1.03%) DNS
4 12 (0.88%) Internet
4 12 (0.88%) LAN
5 11 (0.81%) VoIP
5 11 (0.81%) VPN
6 10 (0.74%) WAN
7 8 (0.59%) Firewall
7 8 (0.59%) Modbus
8 5 (0.37%) 3G
8 5 (0.37%) DHCP
8 5 (0.37%) GPRS
8 5 (0.37%) Intrusion Detection
8 5 (0.37%) LTE
8 5 (0.37%) Wi-Fi
8 5 (0.37%) WLAN
9 4 (0.29%) FTP
9 4 (0.29%) HTTP
9 4 (0.29%) SSL
Database & Business Intelligence
1 71 (5.23%) Power BI
2 48 (3.54%) SAP HANA
3 35 (2.58%) Data Warehouse
4 33 (2.43%) BusinessObjects
5 27 (1.99%) SAP BW
6 23 (1.69%) Tableau
7 22 (1.62%) Data Mining
7 22 (1.62%) SQL Server
8 14 (1.03%) SQL Server Integration Services
9 13 (0.96%) Big Data
9 13 (0.96%) Data Lake
9 13 (0.96%) Relational Database
10 12 (0.88%) DB2
11 11 (0.81%) Power Query
11 11 (0.81%) SQL Server Reporting Services
12 10 (0.74%) SAP Data Services
13 7 (0.52%) Metadata
14 6 (0.44%) BusinessObjects Business Intelligence
14 6 (0.44%) Geospatial Data
15 5 (0.37%) Hadoop
Development Applications
1 40 (2.95%) JIRA
2 17 (1.25%) Rational DOORS
3 11 (0.81%) Robot Framework
4 10 (0.74%) Git
4 10 (0.74%) LSMW
5 5 (0.37%) Oracle Forms
6 4 (0.29%) GitLab
6 4 (0.29%) Jenkins
7 2 (0.15%) Bitbucket
8 1 (0.074%) Eclipse
8 1 (0.074%) JUnit
8 1 (0.074%) kappa
8 1 (0.074%) LabVIEW
8 1 (0.074%) Maven
8 1 (0.074%) MLflow
8 1 (0.074%) Vite
8 1 (0.074%) webpack
General
1 497 (36.62%) Social Skills
2 461 (33.97%) Finance
3 326 (24.02%) Manufacturing
4 236 (17.39%) Analytical Skills
5 123 (9.06%) Marketing
6 102 (7.52%) Law
7 97 (7.15%) Public Sector
8 96 (7.07%) Telecoms
9 88 (6.48%) Electronics
10 80 (5.90%) Inclusion and Diversity
11 79 (5.82%) Retail
12 58 (4.27%) Pharmaceutical
13 45 (3.32%) Presentation Skills
14 42 (3.10%) Legal
15 34 (2.51%) Banking
16 26 (1.92%) Games
17 24 (1.77%) Organisational Skills
18 13 (0.96%) Automotive
18 13 (0.96%) French Language
19 10 (0.74%) Documentation Skills
Job Titles
1 207 (15.25%) Architect
2 177 (13.04%) Consultant
3 169 (12.45%) Analyst
4 164 (12.09%) Senior
5 141 (10.39%) Solutions Architect
6 131 (9.65%) Project Manager
7 125 (9.21%) SAP Consultant
8 106 (7.81%) SAP Architect
9 104 (7.66%) Lead
10 91 (6.71%) SAP Manager
11 73 (5.38%) SAP Solutions Architect
12 64 (4.72%) Senior Manager
13 54 (3.98%) Systems Analyst
14 48 (3.54%) Business Manager
15 47 (3.46%) Configuration Manager
16 44 (3.24%) Development Manager
17 42 (3.10%) Business Development Manager
18 40 (2.95%) Business Consultant
19 39 (2.87%) SAP Business Consultant
20 38 (2.80%) SAP Business One Consultant
Libraries, Frameworks & Software Standards
1 47 (3.46%) SAP Fiori
2 20 (1.47%) EDI
3 18 (1.33%) Middleware
4 16 (1.18%) Web Services
5 14 (1.03%) HTML
6 13 (0.96%) CSS
7 11 (0.81%) MACH
7 11 (0.81%) REST
8 10 (0.74%) SAPUI5
9 9 (0.66%) SAP Basis
10 6 (0.44%) .NET
10 6 (0.44%) Kafka
10 6 (0.44%) React
10 6 (0.44%) SAP Smart Forms
10 6 (0.44%) SAP TM
11 5 (0.37%) IDoc
12 4 (0.29%) .NET Framework
12 4 (0.29%) Flask
12 4 (0.29%) SAP Business Workflow
12 4 (0.29%) XML
Miscellaneous
1 68 (5.01%) Management Information System
2 46 (3.39%) Onboarding
3 44 (3.24%) IoT
4 36 (2.65%) Self-Motivation
5 32 (2.36%) Legacy Systems
6 28 (2.06%) Product Ownership
7 27 (1.99%) Social Media
8 26 (1.92%) Foreign Exchange (FX)
9 24 (1.77%) Enterprise Software
9 24 (1.77%) Virtual Team
10 22 (1.62%) Data Structures
11 21 (1.55%) Blockchain
11 21 (1.55%) Public Cloud
12 20 (1.47%) PMI
13 18 (1.33%) FMCG
14 17 (1.25%) Life Science
15 15 (1.11%) Analytical Mindset
16 12 (0.88%) Cloud Native
16 12 (0.88%) Driving Licence
17 10 (0.74%) Linux Command Line
Operating Systems
1 60 (4.42%) Linux
2 50 (3.68%) Windows
3 32 (2.36%) Windows Server
4 23 (1.69%) Unix
5 10 (0.74%) Red Hat Enterprise Linux
6 7 (0.52%) AIX
7 5 (0.37%) SUSE
7 5 (0.37%) Ubuntu
8 4 (0.29%) Windows Server 2019
9 3 (0.22%) Windows 10
9 3 (0.22%) Windows Server 2016
10 2 (0.15%) CentOS
10 2 (0.15%) Embedded Linux
10 2 (0.15%) Mac OS
10 2 (0.15%) Oracle Linux
11 1 (0.074%) Apple iOS
11 1 (0.074%) Windows Server 2008
11 1 (0.074%) Windows Server 2012
Processes & Methodologies
1 390 (28.74%) ERP
2 268 (19.75%) Problem-Solving
3 247 (18.20%) Project Management
4 221 (16.29%) Agile
5 204 (15.03%) Business Intelligence
6 163 (12.01%) Stakeholder Management
7 148 (10.91%) Roadmaps
8 138 (10.17%) Migration
9 125 (9.21%) Analytics
10 116 (8.55%) CRM
11 115 (8.47%) Project Delivery
12 107 (7.89%) Continuous Improvement
13 103 (7.59%) Decision-Making
14 97 (7.15%) Mentoring
15 96 (7.07%) Change Management
16 95 (7.00%) Programme Management
17 88 (6.48%) Logistics
18 86 (6.34%) Data Management
18 86 (6.34%) Digital Marketing
19 84 (6.19%) Enterprise Architecture
Programming Languages
1 154 (11.35%) SQL
2 74 (5.45%) Python
3 41 (3.02%) ABAP
4 32 (2.36%) Java
5 27 (1.99%) C++
6 18 (1.33%) PowerShell
7 16 (1.18%) C
8 15 (1.11%) JavaScript
8 15 (1.11%) R
9 13 (0.96%) C#
10 11 (0.81%) T-SQL
11 9 (0.66%) PHP
12 8 (0.59%) Data Analysis Expressions
13 7 (0.52%) Perl
14 6 (0.44%) SAPscript
15 5 (0.37%) TypeScript
16 3 (0.22%) VB
17 2 (0.15%) AWK
17 2 (0.15%) Korn
17 2 (0.15%) VBA
Qualifications
1 219 (16.14%) Degree
2 93 (6.85%) Security Cleared
3 39 (2.87%) SC Cleared
4 34 (2.51%) BPSS Clearance
5 30 (2.21%) PMI Certification
5 30 (2.21%) SAP Certification
6 29 (2.14%) Master's Degree
7 20 (1.47%) Computer Science Degree
8 19 (1.40%) ACCA
9 18 (1.33%) CISA
10 15 (1.11%) Azure Certification
11 14 (1.03%) PMP
12 13 (0.96%) Microsoft Certification
13 10 (0.74%) AWS Certification
13 10 (0.74%) CIPFA
13 10 (0.74%) DV Cleared
13 10 (0.74%) QiCA
14 9 (0.66%) HND
15 7 (0.52%) MBA
15 7 (0.52%) PRINCE2 Certification
Quality Assurance & Compliance
1 74 (5.45%) QA
2 54 (3.98%) SLA
3 43 (3.17%) Data Quality
4 21 (1.55%) GMP
5 18 (1.33%) ITGC
6 15 (1.11%) GLP
7 14 (1.03%) GDPR
8 12 (0.88%) PMO
9 10 (0.74%) Sarbanes-Oxley
10 9 (0.66%) CDISC
11 6 (0.44%) Accessibility
11 6 (0.44%) ISO/IEC 27001
11 6 (0.44%) NIST
12 5 (0.37%) ISO/IEC 27002 (supersedes ISO/IEC 17799)
13 4 (0.29%) ISO 13485
13 4 (0.29%) ISO/IEC 27005
13 4 (0.29%) NCSC
14 3 (0.22%) GRC
14 3 (0.22%) NEBOSH
15 2 (0.15%) GxP
System Software
1 18 (1.33%) Active Directory
2 14 (1.03%) Docker
3 9 (0.66%) Hyper-V
3 9 (0.66%) VMware Infrastructure
4 4 (0.29%) Virtual Machines
5 3 (0.22%) Embedded Firmware
5 3 (0.22%) Firmware
5 3 (0.22%) VMware ESXi
5 3 (0.22%) VMware Workstation
5 3 (0.22%) vSphere
6 2 (0.15%) KVM
6 2 (0.15%) Postfix
6 2 (0.15%) Sendmail
6 2 (0.15%) Virtual Desktop
7 1 (0.074%) Virtual Servers
Systems Management
1 14 (1.03%) Kubernetes
2 9 (0.66%) Nagios
3 7 (0.52%) Wonderware InTouch
4 6 (0.44%) Ansible
4 6 (0.44%) Terraform
5 5 (0.37%) Grafana
5 5 (0.37%) Tivoli Storage Manager
6 4 (0.29%) Backup Exec
6 4 (0.29%) Microsoft Intune
6 4 (0.29%) SCCM
7 3 (0.22%) Prometheus
7 3 (0.22%) vCenter Server
7 3 (0.22%) WSUS
8 2 (0.15%) Nessus
8 2 (0.15%) Systems Management Server (SMS)
9 1 (0.074%) HP ALM
9 1 (0.074%) Kubeflow
Vendors
1 294 (21.67%) Microsoft
2 161 (11.86%) Oracle
3 108 (7.96%) Salesforce
4 57 (4.20%) Ariba
5 37 (2.73%) Sage
6 36 (2.65%) Google
7 31 (2.28%) Anaplan
8 30 (2.21%) Hyperion
9 28 (2.06%) OpenText
10 27 (1.99%) Epicor
11 24 (1.77%) IFS
12 22 (1.62%) ServiceNow
13 20 (1.47%) IBM
14 16 (1.18%) Cisco
14 16 (1.18%) Concur
15 14 (1.03%) Databricks
16 13 (0.96%) Dell
16 13 (0.96%) Infor
16 13 (0.96%) Workday
17 10 (0.74%) VMware