Virtual Desktop Jobs

Virtual Desktop
UK

The table below provides summary statistics for permanent job vacancies requiring Virtual Desktop skills. It includes a benchmarking guide to the annual salaries offered in vacancies that cited Virtual Desktop over the 6 months leading up to 16 January 2025, comparing them to the same period in the previous two years.

6 months to
16 Jan 2025
Same period 2024 Same period 2023
Rank 557 503 696
Rank change year-on-year -54 +193 +57
Permanent jobs citing Virtual Desktop 211 244 326
As % of all permanent jobs advertised in the UK 0.32% 0.41% 0.30%
As % of the System Software category 3.03% 2.72% 1.99%
Number of salaries quoted 134 207 241
10th Percentile £32,000 £32,100 £31,250
25th Percentile £40,530 £39,720 £41,250
Median annual salary (50th Percentile) £52,008 £56,525 £52,500
Median % change year-on-year -7.99% +7.67% -
75th Percentile £78,625 £73,750 £70,000
90th Percentile £90,000 £106,250 £78,750
UK excluding London median annual salary £47,500 £47,017 £50,000
% change year-on-year +1.03% -5.97% +21.21%

All System Software Skills
UK

Virtual Desktop falls under the System Software category. For comparison with the information above, the following table provides summary statistics for all permanent job vacancies requiring system software skills.

Permanent vacancies with a requirement for system software skills 6,972 8,955 16,375
As % of all permanent jobs advertised in the UK 10.71% 15.20% 15.27%
Number of salaries quoted 4,020 7,122 11,463
10th Percentile £30,000 £28,750 £29,000
25th Percentile £40,000 £36,750 £37,885
Median annual salary (50th Percentile) £57,500 £55,000 £55,000
Median % change year-on-year +4.55% - -
75th Percentile £77,500 £72,500 £77,715
90th Percentile £98,750 £90,000 £95,000
UK excluding London median annual salary £50,000 £48,000 £47,500
% change year-on-year +4.17% +1.05% -

Virtual Desktop
Job Vacancy Trend

Job postings citing Virtual Desktop as a proportion of all IT jobs advertised.
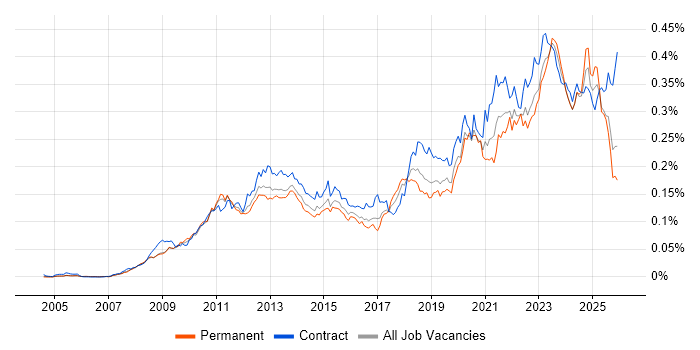
Job vacancy trend for Virtual Desktop in the UK

Virtual Desktop
Salary Trend

3-month moving average salary quoted in jobs citing Virtual Desktop.

Salary trend for Virtual Desktop in the UK

Virtual Desktop
Salary Histogram

Salary distribution for jobs citing Virtual Desktop over the 6 months to 16 January 2025.

Salary histogram for Virtual Desktop in the UK

Virtual Desktop
Top 15 Job Locations

The table below looks at the demand and provides a guide to the median salaries quoted in IT jobs citing Virtual Desktop within the UK over the 6 months to 16 January 2025. The 'Rank Change' column provides an indication of the change in demand within each location based on the same 6 month period last year.

Location Rank Change
on Same Period
Last Year
Matching
Permanent
IT Job Ads
Median Salary
Past 6 Months
Median Salary
% Change
on Same Period
Last Year
Live
Jobs
England -67 196 £51,215 -9.39% 34
UK excluding London -55 125 £47,500 +1.03% 25
London +12 86 £63,881 -11.89% 11
Work from Home -43 51 £77,000 +36.22% 34
South East -39 36 £45,000 -20.39% 6
North of England -44 24 £40,000 -2.99% 7
Midlands -30 23 £52,008 +4.02% 3
East of England -29 21 £55,250 +57.86%
West Midlands -36 20 £52,008 -5.44% 2
North West -24 17 £32,000 -1.54% 4
Scotland +21 8 £80,000 +117.69% 2
Yorkshire +12 7 £80,000 +88.24% 2
South West +10 7 £67,500 +17.39% 4
Northern Ireland +26 6 - -
East Midlands -23 3 - - 1

Virtual Desktop
Co-occurring Skills and Capabilities by Category

The follow tables expand on the table above by listing co-occurrences grouped by category. The same employment type, locality and period is covered with up to 20 co-occurrences shown in each of the following categories:

Application Platforms
1 42 (19.91%) Microsoft Exchange
2 36 (17.06%) SharePoint
3 4 (1.90%) Apache
3 4 (1.90%) Confluence
3 4 (1.90%) nginx
4 2 (0.95%) WordPress
5 1 (0.47%) SharePoint Server
Applications
1 16 (7.58%) Microsoft Office
2 11 (5.21%) Microsoft Excel
3 8 (3.79%) MS Visio
4 2 (0.95%) Microsoft PowerPoint
5 1 (0.47%) Mozilla Thunderbird
Business Applications
1 10 (4.74%) Dynamics CRM
Cloud Services
1 137 (64.93%) Azure
2 134 (63.51%) Microsoft 365
3 54 (25.59%) Entra ID
4 19 (9.00%) SaaS
5 15 (7.11%) AWS
5 15 (7.11%) IaaS
6 14 (6.64%) Azure DevOps
6 14 (6.64%) Azure Storage
6 14 (6.64%) OneDrive
7 13 (6.16%) PaaS
8 12 (5.69%) Azure Event Grid
8 12 (5.69%) Azure Logic Apps
9 10 (4.74%) Dynamics 365
10 6 (2.84%) Azure Monitor
10 6 (2.84%) Mimecast
11 5 (2.37%) Amazon S3
11 5 (2.37%) Microsoft Purview
11 5 (2.37%) Power Platform
12 4 (1.90%) Amazon EC2
12 4 (1.90%) Serverless
Communications & Networking
1 33 (15.64%) DNS
2 31 (14.69%) Firewall
3 30 (14.22%) DHCP
4 17 (8.06%) SAN
5 15 (7.11%) Remote Desktop
6 14 (6.64%) LAN
7 13 (6.16%) VPN
8 12 (5.69%) WAN
9 9 (4.27%) VLAN
10 8 (3.79%) Cisco IOS
10 8 (3.79%) FTP
10 8 (3.79%) IPv4
10 8 (3.79%) PBX
10 8 (3.79%) SMTP
10 8 (3.79%) Structured Cabling
10 8 (3.79%) TCP/IP
11 6 (2.84%) VSAN
12 5 (2.37%) WebEx
13 4 (1.90%) SSL
13 4 (1.90%) Wireless
Database & Business Intelligence
1 13 (6.16%) Amazon RDS
2 10 (4.74%) SQL Server
3 5 (2.37%) Power BI
4 2 (0.95%) Amazon Redshift
4 2 (0.95%) Data Lake
5 1 (0.47%) Azure SQL Database
5 1 (0.47%) Big Data
Development Applications
1 8 (3.79%) Git
1 8 (3.79%) JIRA
2 7 (3.32%) MSI
3 5 (2.37%) Jenkins
4 4 (1.90%) GitLab
4 4 (1.90%) Sonatype Nexus
5 1 (0.47%) Bitbucket Server
5 1 (0.47%) Eclipse
5 1 (0.47%) InstallShield
General
1 69 (32.70%) Social Skills
2 41 (19.43%) Finance
3 23 (10.90%) Analytical Skills
4 22 (10.43%) Public Sector
5 18 (8.53%) Inclusion and Diversity
6 15 (7.11%) Banking
7 10 (4.74%) Local Government
7 10 (4.74%) Retail
8 8 (3.79%) Law
9 5 (2.37%) Manufacturing
10 4 (1.90%) Retail Banking
11 3 (1.42%) Investment Banking
11 3 (1.42%) Police
11 3 (1.42%) Presentation Skills
12 2 (0.95%) Tech for Good
12 2 (0.95%) Telecoms
13 1 (0.47%) Documentation Skills
13 1 (0.47%) Financial Institution
13 1 (0.47%) Legal
13 1 (0.47%) Organisational Skills
Job Titles
1 43 (20.38%) Senior
2 35 (16.59%) Infrastructure Engineer
3 33 (15.64%) Analyst
4 24 (11.37%) Azure Engineer
4 24 (11.37%) IT Support
5 21 (9.95%) Architect
5 21 (9.95%) Consultant
6 20 (9.48%) Service Analyst
6 20 (9.48%) Service Desk Analyst
7 19 (9.00%) Azure Architect
8 18 (8.53%) Support Engineer
9 17 (8.06%) Administrator
10 16 (7.58%) Lead
10 16 (7.58%) Senior Architect
10 16 (7.58%) Senior Solutions Architect
10 16 (7.58%) Solutions Architect
11 14 (6.64%) IT Engineer
12 13 (6.16%) Support Analyst
12 13 (6.16%) Systems Administrator
13 12 (5.69%) IT Manager
Libraries, Frameworks & Software Standards
1 17 (8.06%) ARM Templates
2 12 (5.69%) YAML
3 5 (2.37%) XMPP
4 2 (0.95%) 802.1X
5 1 (0.47%) Azure Blueprints
5 1 (0.47%) Software Packaging
Miscellaneous
1 21 (9.95%) Data Centre
2 16 (7.58%) Onboarding
3 14 (6.64%) Private Cloud
4 9 (4.27%) Product Ownership
5 8 (3.79%) Driving Licence
5 8 (3.79%) Public Cloud
6 7 (3.32%) Self-Motivation
7 6 (2.84%) Clustering
8 4 (1.90%) Client/Server
9 3 (1.42%) Hybrid Cloud
9 3 (1.42%) Management Information System
10 2 (0.95%) iPad
10 2 (0.95%) iPhone
10 2 (0.95%) PKI
11 1 (0.47%) CCTV
11 1 (0.47%) Fat Client
11 1 (0.47%) Legacy Systems
11 1 (0.47%) Mobile App
11 1 (0.47%) Robotics
11 1 (0.47%) Video Conferencing
Operating Systems
1 119 (56.40%) Windows
2 51 (24.17%) Windows 10
3 45 (21.33%) Windows Server
4 23 (10.90%) Android
5 20 (9.48%) Apple iOS
6 17 (8.06%) Linux
6 17 (8.06%) Mac OS
7 13 (6.16%) Windows Server 2016
8 8 (3.79%) VMS
9 6 (2.84%) Windows Server 2019
10 4 (1.90%) Red Hat Enterprise Linux
10 4 (1.90%) Windows Server 2008
10 4 (1.90%) Windows Server 2012
11 1 (0.47%) Mac OS X
11 1 (0.47%) Ubuntu
Processes & Methodologies
1 74 (35.07%) ITIL
2 59 (27.96%) Problem-Solving
3 42 (19.91%) Infrastructure Engineering
4 38 (18.01%) Customer Service
5 33 (15.64%) Roadmaps
6 29 (13.74%) Time Management
7 28 (13.27%) Cybersecurity
7 28 (13.27%) ITSM
8 25 (11.85%) Presales
8 25 (11.85%) Project Delivery
9 21 (9.95%) DevOps
10 20 (9.48%) Proactive Monitoring
10 20 (9.48%) Service Delivery
11 19 (9.00%) Change Management
11 19 (9.00%) Migration
12 18 (8.53%) Service Management
13 16 (7.58%) Mentoring
13 16 (7.58%) Software Licensing
14 15 (7.11%) CI/CD
15 14 (6.64%) Continuous Improvement
Programming Languages
1 58 (27.49%) PowerShell
2 19 (9.00%) SQL
3 18 (8.53%) Bicep
4 15 (7.11%) Kusto Query Language
5 9 (4.27%) Python
6 4 (1.90%) Bash
7 2 (0.95%) C#
7 2 (0.95%) VB
7 2 (0.95%) VBScript
8 1 (0.47%) Shell Script
Qualifications
1 38 (18.01%) Degree
2 27 (12.80%) Microsoft Certification
3 17 (8.06%) Azure Certification
4 13 (6.16%) MCP
4 13 (6.16%) Security Cleared
5 8 (3.79%) CCNA
5 8 (3.79%) Cisco Certification
5 8 (3.79%) Network+ Certification
6 6 (2.84%) DV Cleared
6 6 (2.84%) SC Cleared
7 4 (1.90%) ITIL Certification
7 4 (1.90%) ITIL Foundation Certificate
7 4 (1.90%) VMware Certified Professional (VCP)
8 2 (0.95%) AWS Certification
8 2 (0.95%) AWS Certified Developer
8 2 (0.95%) AWS Certified Solutions Architect
8 2 (0.95%) AWS Certified SysOps Administrator
8 2 (0.95%) Computer Science Degree
8 2 (0.95%) HP ASE
8 2 (0.95%) HP MASE
Quality Assurance & Compliance
1 11 (5.21%) SLA
2 6 (2.84%) Cyber Essentials
3 4 (1.90%) Government Security Classifications
4 3 (1.42%) PMO
5 2 (0.95%) Cyber Essentials PLUS
System Software
1 80 (37.91%) Active Directory
2 46 (21.80%) VMware Infrastructure
3 35 (16.59%) Hyper-V
4 24 (11.37%) Virtual Machines
4 24 (11.37%) VMware ESXi
5 9 (4.27%) VMware NSX
6 7 (3.32%) XenApp
7 5 (2.37%) Virtual Servers
8 2 (0.95%) pfSense
8 2 (0.95%) Terminal Server
9 1 (0.47%) Docker
9 1 (0.47%) VMware Workstation
9 1 (0.47%) vSphere
Systems Management
1 72 (34.12%) Microsoft Intune
2 46 (21.80%) SCCM
3 21 (9.95%) Terraform
4 10 (4.74%) WSUS
5 9 (4.27%) Ansible
6 8 (3.79%) Puppet
6 8 (3.79%) vCenter Server
6 8 (3.79%) VxRail
7 6 (2.84%) SCOM
8 4 (1.90%) Avamar
8 4 (1.90%) Graylog
8 4 (1.90%) Microsoft Clustering
8 4 (1.90%) Nagios
8 4 (1.90%) Packer
8 4 (1.90%) Progress Chef
8 4 (1.90%) Rundeck
9 3 (1.42%) Active Directory Federation Services
9 3 (1.42%) Single Sign-On
10 2 (0.95%) Failover Clustering
10 2 (0.95%) Jamf Pro
Vendors
1 146 (69.19%) Microsoft
2 46 (21.80%) VMware
3 36 (17.06%) Citrix
4 30 (14.22%) Cisco
5 18 (8.53%) Apple
6 17 (8.06%) Adobe
7 14 (6.64%) ServiceNow
8 13 (6.16%) Veeam
9 12 (5.69%) Dell
10 11 (5.21%) Meraki
11 8 (3.79%) EMC
12 7 (3.32%) Aruba
13 6 (2.84%) Arista
13 6 (2.84%) Palo Alto
13 6 (2.84%) Sophos
13 6 (2.84%) Zscaler
14 5 (2.37%) Juniper
15 4 (1.90%) NetApp
15 4 (1.90%) PagerDuty
15 4 (1.90%) Pure Storage