Test Engineer
UK
The median Test Engineer salary in the UK is £55,000 per year, according to job vacancies posted during the 6 months leading to 28 May 2025.
The table below provides salary benchmarking and summary statistics, comparing them to the same period in the previous two years.
| 6 months to 28 May 2025 |
Same period 2024 | Same period 2023 | |
|---|---|---|---|
| Rank | 152 | 527 | 492 |
| Rank change year-on-year | +375 | -35 | -12 |
| Permanent jobs requiring a Test Engineer | 1,158 | 425 | 571 |
| As % of all permanent jobs advertised in the UK | 2.12% | 0.42% | 0.58% |
| As % of the Job Titles category | 2.34% | 0.44% | 0.64% |
| Number of salaries quoted | 174 | 251 | 383 |
| 10th Percentile | - | £32,500 | £34,800 |
| 25th Percentile | £40,000 | £39,166 | £41,250 |
| Median annual salary (50th Percentile) | £55,000 | £45,000 | £54,000 |
| Median % change year-on-year | +22.22% | -16.67% | +8.00% |
| 75th Percentile | £60,000 | £53,750 | £65,000 |
| 90th Percentile | £63,025 | £65,000 | £75,000 |
| UK excluding London median annual salary | £55,000 | £45,000 | £50,000 |
| % change year-on-year | +22.22% | -10.00% | +11.11% |
All Permanent IT Job Vacancies
UK
For comparison with the information above, the following table provides summary statistics for all permanent IT job vacancies. Most job vacancies include a discernible job title that can be normalized. As such, the figures in the second row provide an indication of the number of permanent jobs in our overall sample.
| Permanent vacancies in the UK with a recognized job title | 49,435 | 96,820 | 89,564 |
| % of permanent jobs with a recognized job title | 90.41% | 94.78% | 91.46% |
| Number of salaries quoted | 25,727 | 69,155 | 56,824 |
| 10th Percentile | £28,822 | £28,500 | £32,500 |
| 25th Percentile | £41,000 | £38,500 | £45,000 |
| Median annual salary (50th Percentile) | £55,000 | £52,500 | £60,000 |
| Median % change year-on-year | +4.76% | -12.50% | - |
| 75th Percentile | £73,750 | £70,000 | £80,000 |
| 90th Percentile | £96,250 | £90,000 | £100,000 |
| UK excluding London median annual salary | £51,399 | £50,000 | £53,500 |
| % change year-on-year | +2.80% | -6.54% | +6.63% |
Test Engineer
Job Vacancy Trend
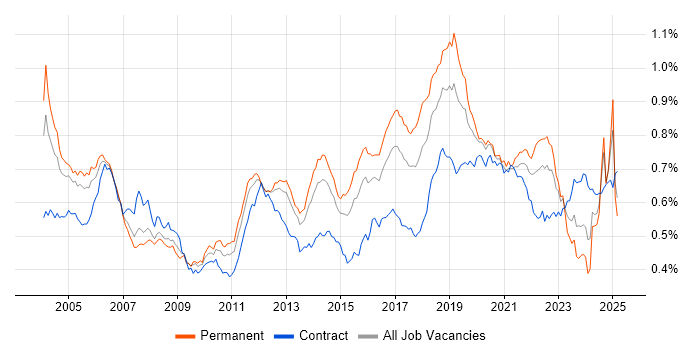
Job postings that featured Test Engineer in the job title as a proportion of all IT jobs advertised.

Test Engineer
Salary Trend
3-month moving average salary quoted in jobs citing Test Engineer.
Test Engineer
Salary Histogram
Salary distribution for jobs citing Test Engineer over the 6 months to 28 May 2025.
Test Engineer
Top 16 Job Locations
The table below looks at the demand and provides a guide to the median salaries quoted in IT jobs citing Test Engineer within the UK over the 6 months to 28 May 2025. The 'Rank Change' column provides an indication of the change in demand within each location based on the same 6 month period last year.
| Location | Rank Change on Same Period Last Year |
Matching Permanent IT Job Ads |
Median Salary Past 6 Months |
Median Salary % Change on Same Period Last Year |
Live Jobs |
|---|---|---|---|---|---|
| England | +377 | 1,124 | £55,000 | +22.22% | 479 |
| UK excluding London | +328 | 1,098 | £55,000 | +22.22% | 456 |
| South East | +225 | 404 | £60,000 | +33.33% | 111 |
| East of England | +152 | 378 | £42,000 | -6.67% | 75 |
| Midlands | +182 | 232 | £34,000 | -20.00% | 82 |
| East Midlands | +158 | 221 | £33,000 | -12.00% | 26 |
| Work from Home | +48 | 43 | £55,000 | +16.07% | 121 |
| South West | +96 | 37 | £52,500 | +5.00% | 72 |
| London | +128 | 31 | £46,500 | -27.06% | 62 |
| North of England | +36 | 29 | £46,250 | +5.71% | 86 |
| North West | +9 | 21 | £45,000 | -5.26% | 40 |
| Wales | +46 | 15 | £55,062 | +29.56% | 20 |
| West Midlands | +28 | 11 | £60,000 | +41.18% | 54 |
| Scotland | +101 | 10 | £55,000 | +22.22% | 22 |
| Yorkshire | +51 | 8 | £59,800 | +54.32% | 24 |
| Northern Ireland | +40 | 1 | - | - | 3 |
Test Engineer Skill Set
Top 30 Co-occurring Skills and Capabilities
For the 6 months to 28 May 2025, Test Engineer job roles required the following skills and capabilities in order of popularity. The figures indicate the absolute number co-occurrences and as a proportion of all permanent job ads featuring Test Engineer in the job title.
|
|
Test Engineer Skill Set
Co-occurring Skills and Capabilities by Category
The follow tables expand on the table above by listing co-occurrences grouped by category. The same employment type, locality and period is covered with up to 20 co-occurrences shown in each of the following categories:
|
|
||||||||||||||||||||||||||||||||||||||||||||||||||||||||||||||||||||||||||||||||||||||||||||||||||||||||||||||||||||||||||||||
|
|
||||||||||||||||||||||||||||||||||||||||||||||||||||||||||||||||||||||||||||||||||||||||||||||||||||||||||||||||||||||||||||||
|
|
||||||||||||||||||||||||||||||||||||||||||||||||||||||||||||||||||||||||||||||||||||||||||||||||||||||||||||||||||||||||||||||
|
|
||||||||||||||||||||||||||||||||||||||||||||||||||||||||||||||||||||||||||||||||||||||||||||||||||||||||||||||||||||||||||||||
|
|
||||||||||||||||||||||||||||||||||||||||||||||||||||||||||||||||||||||||||||||||||||||||||||||||||||||||||||||||||||||||||||||
|
|
||||||||||||||||||||||||||||||||||||||||||||||||||||||||||||||||||||||||||||||||||||||||||||||||||||||||||||||||||||||||||||||
|
|
||||||||||||||||||||||||||||||||||||||||||||||||||||||||||||||||||||||||||||||||||||||||||||||||||||||||||||||||||||||||||||||
|
|
||||||||||||||||||||||||||||||||||||||||||||||||||||||||||||||||||||||||||||||||||||||||||||||||||||||||||||||||||||||||||||||
|
|
||||||||||||||||||||||||||||||||||||||||||||||||||||||||||||||||||||||||||||||||||||||||||||||||||||||||||||||||||||||||||||||
