Software Engineering Jobs

Software Engineering
UK

The table below provides summary statistics for permanent job vacancies requiring Software Engineering skills. It includes a benchmarking guide to the annual salaries offered in vacancies that cited Software Engineering over the 6 months leading up to 26 July 2024, comparing them to the same period in the previous two years.

6 months to
26 Jul 2024
Same period 2023 Same period 2022
Rank 10 19 10
Rank change year-on-year +9 -9 +5
Permanent jobs citing Software Engineering 10,765 8,035 30,602
As % of all permanent jobs advertised in the UK 11.91% 9.96% 17.46%
As % of the Processes & Methodologies category 14.55% 10.44% 18.11%
Number of salaries quoted 6,756 5,329 10,274
10th Percentile £40,000 £42,500 £41,250
25th Percentile £48,250 £53,750 £48,750
Median annual salary (50th Percentile) £62,500 £70,000 £69,078
Median % change year-on-year -10.71% +1.34% +10.52%
75th Percentile £85,000 £95,000 £90,000
90th Percentile £115,000 £120,000 £115,000
UK excluding London median annual salary £57,500 £61,500 £57,500
% change year-on-year -6.50% +6.96% +8.49%

All Process and Methodology Skills
UK

Software Engineering falls under the Processes and Methodologies category. For comparison with the information above, the following table provides summary statistics for all permanent job vacancies requiring process or methodology skills.

Permanent vacancies with a requirement for process or methodology skills 73,969 76,929 168,958
As % of all permanent jobs advertised in the UK 81.84% 95.34% 96.40%
Number of salaries quoted 48,628 50,249 85,709
10th Percentile £30,000 £33,750 £33,750
25th Percentile £40,000 £45,000 £44,250
Median annual salary (50th Percentile) £55,000 £60,000 £60,000
Median % change year-on-year -8.33% - +9.09%
75th Percentile £73,750 £80,000 £80,000
90th Percentile £93,750 £100,000 £96,250
UK excluding London median annual salary £50,000 £55,000 £52,500
% change year-on-year -9.09% +4.76% +6.06%

Software Engineering
Job Vacancy Trend

Job postings citing Software Engineering as a proportion of all IT jobs advertised.
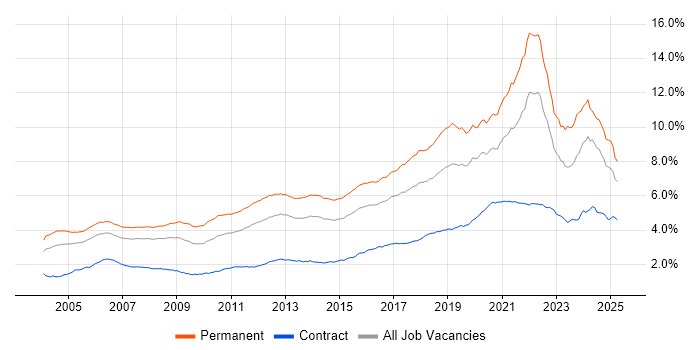
Job vacancy trend for Software Engineering in the UK

Software Engineering
Salary Trend

3-month moving average salary quoted in jobs citing Software Engineering.

Salary trend for Software Engineering in the UK

Software Engineering
Salary Histogram

Salary distribution for jobs citing Software Engineering over the 6 months to 26 July 2024.

Salary histogram for Software Engineering in the UK

Software Engineering
Top 17 Job Locations

The table below looks at the demand and provides a guide to the median salaries quoted in IT jobs citing Software Engineering within the UK over the 6 months to 26 July 2024. The 'Rank Change' column provides an indication of the change in demand within each location based on the same 6 month period last year.

Location Rank Change
on Same Period
Last Year
Matching
Permanent
IT Job Ads
Median Salary
Past 6 Months
Median Salary
% Change
on Same Period
Last Year
Live
Jobs
UK excluding London +9 8,025 £57,500 -6.50% 824
England +6 7,995 £65,000 -10.34% 889
Work from Home +3 3,680 £67,250 -7.24% 512
London +1 2,341 £95,000 +5.56% 222
Scotland +12 2,198 £60,000 -4.00% 66
North of England +11 1,692 £57,500 -4.17% 154
South East +9 1,524 £55,000 -15.38% 159
South West +12 1,104 £57,500 -11.54% 166
North West +17 1,033 £60,000 -4.00% 100
Midlands +11 826 £55,000 -4.35% 131
Yorkshire +10 522 £55,000 -8.33% 29
East of England +15 427 £60,000 -7.69% 85
East Midlands +10 422 £47,500 -17.39% 67
West Midlands +11 404 £60,000 +4.35% 62
Wales +16 171 £50,000 - 9
North East +9 137 £55,000 +4.76% 26
Northern Ireland +2 85 £65,000 +23.81% 72

Software Engineering
Co-occurring Skills and Capabilities by Category

The follow tables expand on the table above by listing co-occurrences grouped by category. The same employment type, locality and period is covered with up to 20 co-occurrences shown in each of the following categories:

Application Platforms
1 807 (7.50%) Apache
2 778 (7.23%) Apache Airflow
3 432 (4.01%) Apache Spark
4 224 (2.08%) ArcGIS
5 214 (1.99%) GeoServer
6 98 (0.91%) FileNet
7 73 (0.68%) Confluence
8 42 (0.39%) SharePoint
9 34 (0.32%) Cloud Foundry
10 28 (0.26%) nginx
11 24 (0.22%) CMS
12 21 (0.20%) GemFire
13 15 (0.14%) NServiceBus
14 14 (0.13%) Tomcat
15 12 (0.11%) Tuxedo
16 11 (0.10%) CICS
16 11 (0.10%) IIS
17 8 (0.074%) WordPress
18 7 (0.065%) Appian
18 7 (0.065%) Microsoft Exchange
Applications
1 140 (1.30%) Simulink
2 30 (0.28%) Microsoft Excel
3 15 (0.14%) Stateflow
4 14 (0.13%) AutoCAD
4 14 (0.13%) Microsoft Office
5 12 (0.11%) CPLEX
6 11 (0.10%) OrCAD
7 8 (0.074%) Spreadsheet
8 7 (0.065%) MS Visio
9 5 (0.046%) Trello
10 4 (0.037%) CANalyzer
10 4 (0.037%) GNU Octave
10 4 (0.037%) Microsoft PowerPoint
11 3 (0.028%) Chatbot
11 3 (0.028%) SketchUp
11 3 (0.028%) SOLIDWORKS
12 2 (0.019%) Adobe Creative Suite
12 2 (0.019%) Autodesk Inventor
12 2 (0.019%) Fusion 360
12 2 (0.019%) Revit
Business Applications
1 50 (0.46%) Dynamics CRM
2 31 (0.29%) Ripple
3 8 (0.074%) Payment Gateway
4 5 (0.046%) Magento
4 5 (0.046%) SAP S/4HANA
5 4 (0.037%) C-CURE
5 4 (0.037%) Endur
6 3 (0.028%) Dynamics AX
6 3 (0.028%) Shopify
7 2 (0.019%) CiviCRM
7 2 (0.019%) Dynamics NAV
7 2 (0.019%) Findur
7 2 (0.019%) SAP ERP
7 2 (0.019%) Towers Watson Igloo
8 1 (0.009%) Infor M3
8 1 (0.009%) NetSuite
8 1 (0.009%) Ripple XRP
8 1 (0.009%) SAP EHS
8 1 (0.009%) Teamcenter
Cloud Services
1 3,390 (31.49%) AWS
2 1,922 (17.85%) Azure
3 1,017 (9.45%) GCP
4 564 (5.24%) dbt
5 473 (4.39%) Snowflake
6 359 (3.33%) Serverless
7 315 (2.93%) SaaS
8 300 (2.79%) Azure DevOps
9 255 (2.37%) GitHub
10 225 (2.09%) AWS Lambda
11 209 (1.94%) Amazon S3
12 183 (1.70%) Amazon ECS
12 183 (1.70%) Amazon EKS
13 174 (1.62%) Power Platform
14 171 (1.59%) Amazon EC2
15 163 (1.51%) Dynamics 365
16 141 (1.31%) Datadog
17 102 (0.95%) GitHub Actions
18 101 (0.94%) Cloud Computing
19 90 (0.84%) Amazon Kinesis
Communications & Networking
1 116 (1.08%) Network Security
2 92 (0.85%) Wireless
3 86 (0.80%) TCP/IP
4 64 (0.59%) Ethernet
4 64 (0.59%) HTTP
5 61 (0.57%) Kerberos
6 50 (0.46%) Wi-Fi
7 46 (0.43%) MQTT
8 41 (0.38%) AMQP
9 39 (0.36%) Internet
9 39 (0.36%) RS-232
10 30 (0.28%) RS-485
11 27 (0.25%) Bluetooth
12 23 (0.21%) 4G
13 16 (0.15%) Firewall
14 15 (0.14%) DNS
15 14 (0.13%) 3G
15 14 (0.13%) 5G
15 14 (0.13%) Modbus
16 11 (0.10%) Wireshark
Database & Business Intelligence
1 775 (7.20%) NoSQL
2 679 (6.31%) PostgreSQL
3 634 (5.89%) Apache Ignite
4 554 (5.15%) Data Lake
5 544 (5.05%) Amazon Athena
6 540 (5.02%) Dremio
7 510 (4.74%) Apache Arrow
8 361 (3.35%) Big Data
9 327 (3.04%) MySQL
10 280 (2.60%) SQL Server
11 245 (2.28%) GIS
12 242 (2.25%) Relational Database
13 218 (2.03%) QGIS
14 200 (1.86%) Elasticsearch
15 177 (1.64%) Hadoop
16 153 (1.42%) MongoDB
17 152 (1.41%) Apache Cassandra
18 140 (1.30%) DynamoDB
19 122 (1.13%) Amazon RDS
20 110 (1.02%) Redis
Development Applications
1 829 (7.70%) Git
2 337 (3.13%) Jenkins
3 224 (2.08%) JUnit
4 216 (2.01%) Cypress.io
5 214 (1.99%) JIRA
6 203 (1.89%) GitLab
7 188 (1.75%) Visual Studio
8 132 (1.23%) Selenium
9 120 (1.11%) Jasmine
10 112 (1.04%) Bitbucket
11 92 (0.85%) LabVIEW
12 69 (0.64%) Maven
13 66 (0.61%) WebDriver
14 63 (0.59%) Protractor
15 62 (0.58%) Karma Test Runner
16 60 (0.56%) Bitbucket Server
17 54 (0.50%) Artifactory
18 52 (0.48%) Cucumber
18 52 (0.48%) Mockito
18 52 (0.48%) Subversion
General
1 3,055 (28.38%) Finance
2 2,185 (20.30%) Inclusion and Diversity
3 1,771 (16.45%) Law
4 1,274 (11.83%) Social Skills
5 1,068 (9.92%) Banking
6 865 (8.04%) Marketing
7 818 (7.60%) Front Office
8 795 (7.39%) Investment Banking
9 645 (5.99%) Legal
10 453 (4.21%) Electronics
11 373 (3.46%) Analytical Skills
12 363 (3.37%) Manufacturing
13 213 (1.98%) Automotive
14 211 (1.96%) Financial Institution
15 203 (1.89%) Public Sector
16 183 (1.70%) Aerospace
17 170 (1.58%) Retail
18 139 (1.29%) Games
19 109 (1.01%) Influencing Skills
20 105 (0.98%) Tech for Good
Job Titles
1 7,079 (65.76%) Software Engineer
2 2,647 (24.59%) Senior
3 2,039 (18.94%) Senior Software Engineer
4 1,621 (15.06%) Developer
5 1,557 (14.46%) Lead
6 1,131 (10.51%) Embedded Engineer
7 1,069 (9.93%) Embedded Software Engineer
8 969 (9.00%) Lead Software Engineer
9 951 (8.83%) Java Engineer
10 912 (8.47%) Java Software Engineer
11 740 (6.87%) Python Engineer
12 676 (6.28%) Python Software Engineer
13 517 (4.80%) AWS Engineer
14 480 (4.46%) AWS Software Engineer
14 480 (4.46%) Software Developer
15 455 (4.23%) Architect
16 416 (3.86%) Developer/Software Engineer
17 407 (3.78%) Full Stack Engineer
18 391 (3.63%) Senior Embedded Engineer
19 380 (3.53%) Senior Embedded Software Engineer
Libraries, Frameworks & Software Standards
1 1,693 (15.73%) React
2 1,528 (14.19%) .NET
3 804 (7.47%) AngularJS
4 784 (7.28%) CSS
5 762 (7.08%) Spring
6 699 (6.49%) gRPC
7 676 (6.28%) Node.js
8 656 (6.09%) Protocol Buffers
9 632 (5.87%) HTML
10 618 (5.74%) Pandas
11 606 (5.63%) NumPy
12 568 (5.28%) .NET Core
13 539 (5.01%) SciPy
14 492 (4.57%) Kafka
15 448 (4.16%) RESTful
16 413 (3.84%) Spring Boot
17 355 (3.30%) REST
18 343 (3.19%) Web Services
19 323 (3.00%) GraphQL
20 290 (2.69%) JSON
Miscellaneous
1 910 (8.45%) Cloud Native
2 880 (8.17%) Algorithms
3 741 (6.88%) Fixed Income
4 676 (6.28%) Hedge funds
5 630 (5.85%) Equities
6 589 (5.47%) Foreign Exchange (FX)
7 572 (5.31%) Derivative
8 297 (2.76%) Distributed Systems
9 266 (2.47%) Cyberattack
10 216 (2.01%) Onboarding
11 201 (1.87%) Product Ownership
12 196 (1.82%) IoT
13 195 (1.81%) Data Structures
14 194 (1.80%) Public Cloud
15 192 (1.78%) Self-Motivation
16 187 (1.74%) Embedded Systems
17 186 (1.73%) Management Information System
18 181 (1.68%) Greenfield Project
19 104 (0.97%) Mobile App
20 95 (0.88%) Robotics
Operating Systems
1 1,176 (10.92%) Linux
2 419 (3.89%) Windows
3 230 (2.14%) Embedded Linux
4 174 (1.62%) Android
5 164 (1.52%) Unix
6 93 (0.86%) Ubuntu
7 92 (0.85%) Red Hat Enterprise Linux
8 90 (0.84%) Apple iOS
9 71 (0.66%) CentOS
10 38 (0.35%) Debian
11 26 (0.24%) Windows Server
12 24 (0.22%) FreeRTOS
13 13 (0.12%) Windows 10
14 12 (0.11%) Mac OS
15 7 (0.065%) Alpine Linux
16 6 (0.056%) VMS
16 6 (0.056%) VxWorks
17 5 (0.046%) Kali Linux
17 5 (0.046%) Windows Embedded Compact
18 4 (0.037%) Amazon Linux
Processes & Methodologies
1 4,628 (42.99%) Agile
2 2,155 (20.02%) CI/CD
3 1,891 (17.57%) SDLC
4 1,737 (16.14%) Machine Learning
5 1,568 (14.57%) Artificial Intelligence
6 1,461 (13.57%) Problem-Solving
7 1,376 (12.78%) DevOps
8 1,344 (12.48%) Computer Science
9 1,252 (11.63%) Operational Stability
10 1,164 (10.81%) Full Stack Development
11 1,089 (10.12%) Mentoring
12 965 (8.96%) Microservices
13 941 (8.74%) Community of Practice
14 879 (8.17%) Asset Management
15 780 (7.25%) Continuous Improvement
16 743 (6.90%) Visualisation
17 712 (6.61%) TDD
18 686 (6.37%) Test Automation
19 611 (5.68%) Investment Management
20 579 (5.38%) Risk Management
Programming Languages
1 3,123 (29.01%) Python
2 2,920 (27.12%) Java
3 2,234 (20.75%) JavaScript
4 1,880 (17.46%) C#
5 1,817 (16.88%) SQL
6 1,605 (14.91%) TypeScript
7 1,333 (12.38%) C++
8 1,090 (10.13%) C
9 395 (3.67%) Scala
10 326 (3.03%) Kotlin
11 313 (2.91%) Go
12 243 (2.26%) PHP
13 227 (2.11%) Embedded C
14 225 (2.09%) Rust
15 219 (2.03%) Bash
16 108 (1.00%) MATLAB
17 96 (0.89%) PL/SQL
18 94 (0.87%) PowerShell
19 79 (0.73%) Embedded C++
20 78 (0.72%) Ruby
Qualifications
1 1,562 (14.51%) Degree
2 1,102 (10.24%) Security Cleared
3 662 (6.15%) SC Cleared
4 542 (5.03%) Computer Science Degree
5 288 (2.68%) Master's Degree
6 215 (2.00%) DV Cleared
7 155 (1.44%) PhD
8 113 (1.05%) BPSS Clearance
9 55 (0.51%) DBS Check
10 40 (0.37%) Microsoft Certification
11 26 (0.24%) AWS Certification
11 26 (0.24%) Azure Certification
12 24 (0.22%) HND
13 21 (0.20%) ISTQB
14 18 (0.17%) HNC
15 17 (0.16%) PMI Certification
16 15 (0.14%) AWS Certified Solutions Architect
17 14 (0.13%) CISSP
18 11 (0.10%) Numerate Degree
19 9 (0.084%) Postgraduate
Quality Assurance & Compliance
1 284 (2.64%) QA
2 202 (1.88%) Data Quality
3 88 (0.82%) Accessibility
4 32 (0.30%) MISRA
5 28 (0.26%) GDPR
6 23 (0.21%) ISO 26262
6 23 (0.21%) SLA
7 22 (0.20%) NCSC
8 21 (0.20%) ISO/IEC 27001
9 20 (0.19%) PCI DSS
10 17 (0.16%) AUTOSAR
11 16 (0.15%) PMO
12 13 (0.12%) Def Stans
12 13 (0.12%) ISO 13485
12 13 (0.12%) NIST
13 12 (0.11%) IEC 61508
14 11 (0.10%) ISO 9001
14 11 (0.10%) Software Quality Assurance
15 10 (0.093%) GRC
15 10 (0.093%) JTAG
System Software
1 704 (6.54%) Docker
2 237 (2.20%) Firmware
3 110 (1.02%) Embedded Firmware
4 71 (0.66%) Active Directory
5 62 (0.58%) HDFS
6 58 (0.54%) Virtual Machines
7 13 (0.12%) VMware Infrastructure
8 11 (0.10%) IAG
8 11 (0.10%) Time Sharing Option
9 8 (0.074%) Virtual Servers
10 6 (0.056%) Ceph
11 5 (0.046%) Slurm Workload Manager
12 4 (0.037%) NFS
13 3 (0.028%) Hyper-V
13 3 (0.028%) VirtualBox
14 2 (0.019%) Apache ZooKeeper
14 2 (0.019%) VMware ESXi
15 1 (0.009%) Microsoft Virtual Server
15 1 (0.009%) Virtual Desktop
Systems Management
1 1,014 (9.42%) Kubernetes
2 703 (6.53%) Terraform
3 232 (2.16%) Ansible
4 205 (1.90%) Grafana
5 108 (1.00%) Prometheus
6 50 (0.46%) Puppet
7 32 (0.30%) Progress Chef
8 30 (0.28%) Kibana
9 26 (0.24%) ITRS Geneos
10 21 (0.20%) HAProxy
10 21 (0.20%) Zipkin
11 13 (0.12%) Salt
12 9 (0.084%) Docker Swarm
13 7 (0.065%) Graphite
14 6 (0.056%) Argo
14 6 (0.056%) Computer Emergency Response Teams
14 6 (0.056%) Istio
14 6 (0.056%) Knative
14 6 (0.056%) Nessus
14 6 (0.056%) SELinux
Vendors
1 630 (5.85%) Microsoft
2 360 (3.34%) Google
3 307 (2.85%) Oracle
4 224 (2.08%) ESRI
5 195 (1.81%) Databricks
6 188 (1.75%) Splunk
7 144 (1.34%) Dynatrace
8 76 (0.71%) Bloomberg
9 67 (0.62%) Informatica
10 66 (0.61%) Xilinx
11 60 (0.56%) Reuters
12 46 (0.43%) SAP
13 44 (0.41%) Red Hat
14 40 (0.37%) Micro Focus
15 39 (0.36%) SaltStack
16 36 (0.33%) IBM
17 35 (0.33%) Alteryx
18 33 (0.31%) Cloudera
19 32 (0.30%) Atlassian
20 31 (0.29%) Siemens